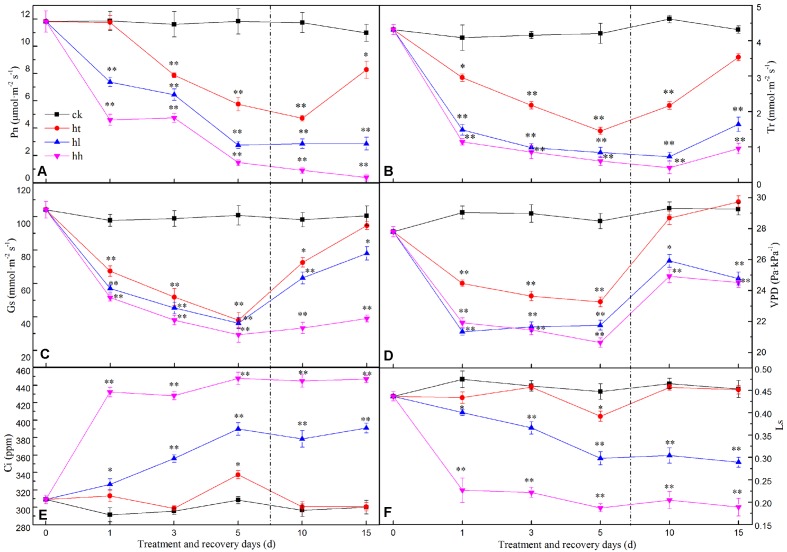
FIGURE 1.
Effects of sub-high temperature and high light treatment and recovery on the net photosynthetic rate (Pn, A), transpiration rate (Tr, B), stomatal conductance (Gs, C), vapor pressure deficit (VPD, D), intercellular CO2 concentration (Ci, E), and stomatal limitation value (Ls, F) of tomato leaves. The vertical dashed line indicates the transfer of plants back to the control phytotron. Data are the means of six replicates with standard errors shown by vertical bars. ∗indicates significant difference (P ≤ 0.05), and ∗∗indicates a highly significant difference (P ≤ 0.01).

