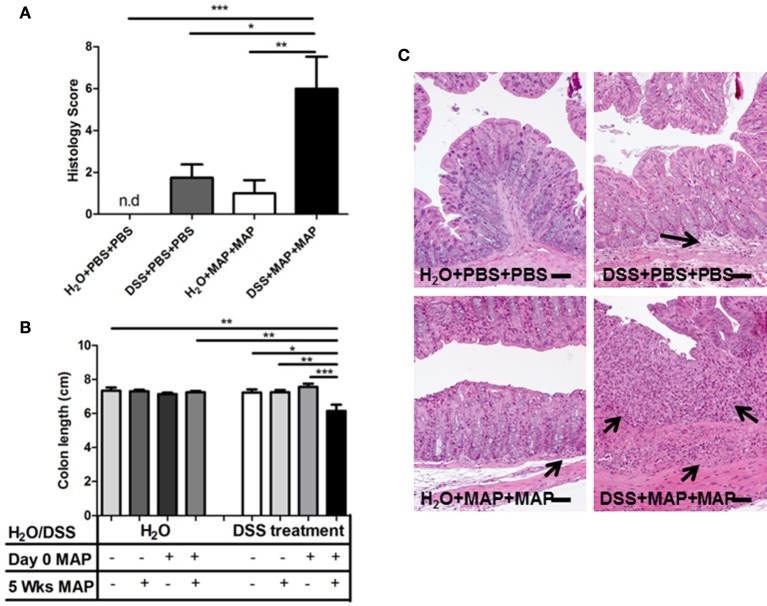
Figure 2.
Pathology of colon after exposure of DSS pretreated mice to MAP. (A) Histology score of the colon was established at 1 day after secondary exposure (n = 3–5). n.d, not detected, histology score = 0. (B) Upon the necropsy at 1 day after secondary exposure, colon length was measured. Colon lengths in cm (n = 3–5). (C) H&E staining colon tissue section at 1 day after secondary exposure. Scale bars, 25 μm. H2O+PBS+PBS (upper left) showed normal tissue. H2O+MAP+MAP (bottom left) and DSS+PBS+PBS (upper right) showed mild infiltration of inflammatory cells (black arrow). DSS+MAP+MAP (bottom right) showed high invasion of inflammatory cells (black arrow) and severe epithelial hyperplasia. Graph show a representative of at least two independent experiments, show as Mean ± SEM. *P < 0.05; **p < 0.01; ***p < 0.001, one-way ANOVA with Tukey's multiple comparison post-test.

