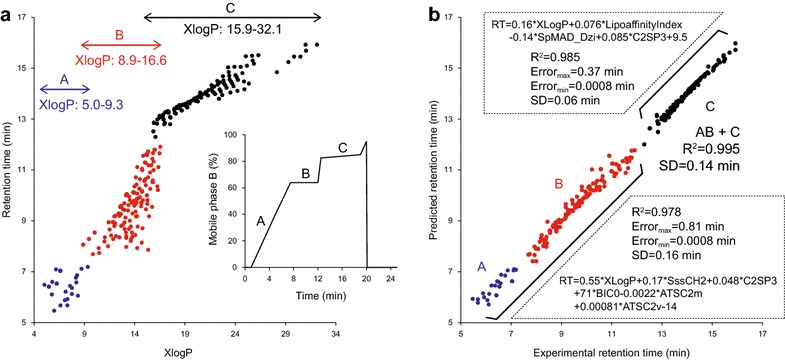
Fig. 3.

Retention time prediction of lipids in reverse-phase liquid chromatography. a The x- and y-axes show the calculated LogP (XLogP) and the experimental retention time of lipid molecules. The LC gradient condition is shown in the right panel. The eluted lipids in gradient stage A, B, and C are depicted as blue, red, and black circles, respectively. b The x- and y-axes show the experimental- and predicted retention times, respectively. The colors indicate the gradient stage. Two equations for retention time predictions of stage A + B and stage C are shown. SD is the standard deviation of the prediction errors
