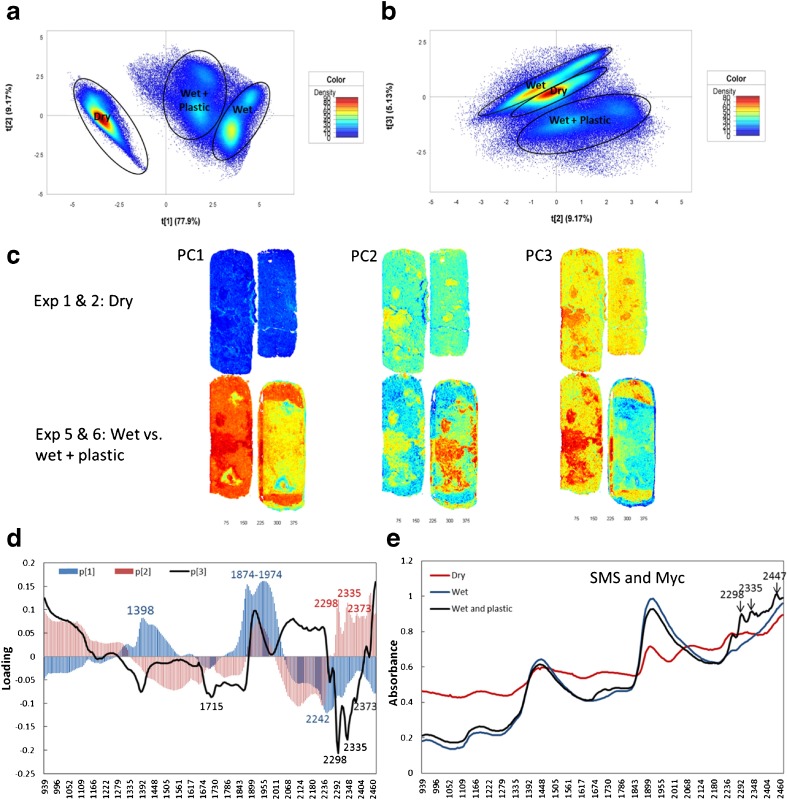
Fig. 2.
Overview principal components analysis (PCA) modeling for the comparison of studied factors. One run from Exp. 1 and 2 (dry materials), Exp. 5 (wet materials), and Exp. 6 (wet and plastic covered materials) were used to merge this multiple mosaic for the PCA modeling. a, b The pixel score plots. c The scores plot of the related principal components (PC). d The loading plot of the first (blue), the second (red), and the third (dark) components. e The average spectra of the pixel clusters of the dry, the wet, and the wet and plastic covered materials, including spent mushroom substrate (SMS) and mycelia (Myc)

