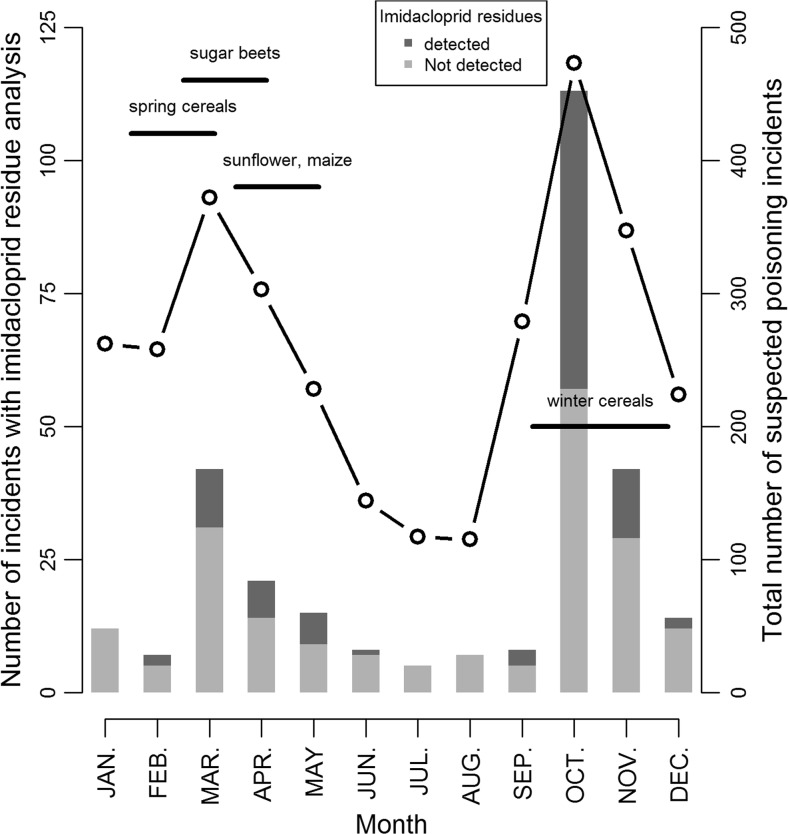
Fig. 3.
Monthly distribution of incidents for which residue analysis of imidacloprid has been performed (stacked bars and left hand axis), and total number of suspected poisoning incidents (curve and right hand axis) reported by SAGIR from 1 January 1995 to 31 December 2014, and corresponding sowing periods of maize, spring and winter cereals, sunflower, and sugar beet

