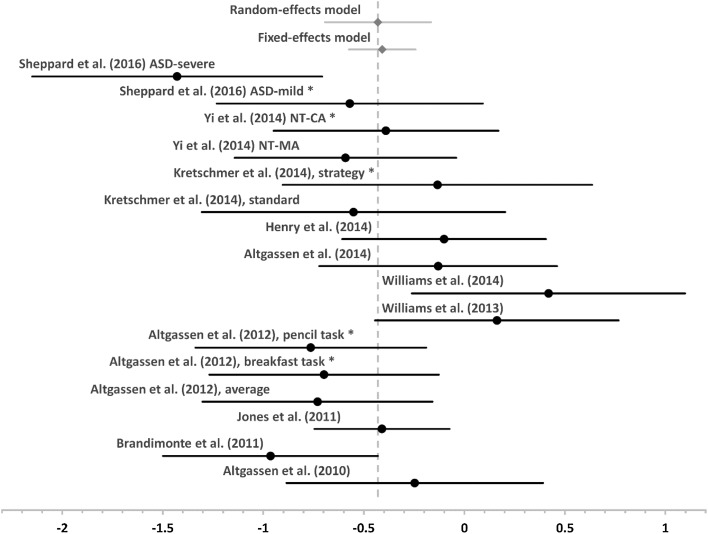
Fig. 4.
Forest plot for effect sizes and 95% confidence interval for event-based PM studies as well as the mean weighted effect and its 95% confidence interval for both fixed- and random-effects models (in grey, diamond marker). Vertical grey line marks the weighted mean effect of the random-effects model. Studies marked with an asterisk were not included in the meta-analysis

