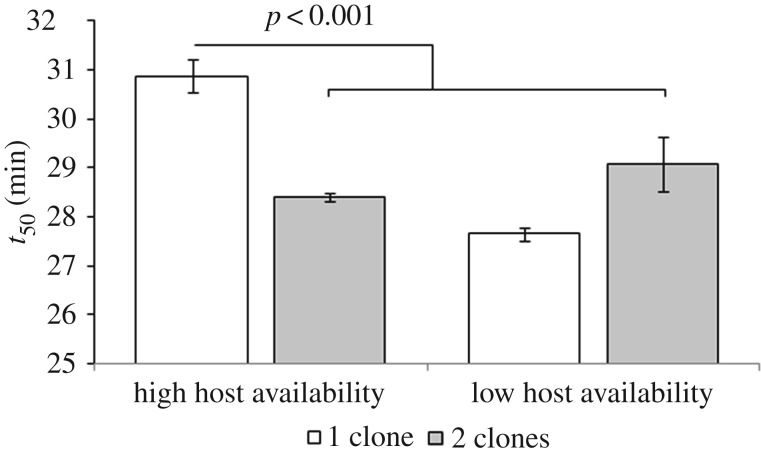
Figure 3.
Time to kill (t50) of evolved virus populations. Viruses were evolved in subpopulations where relatedness was either relatively high (1 clone) or low (2 clones), and where their growth was relatively unconstrained or constrained by high or low host availability. Data are means (n = 6) ± s.e.m.

