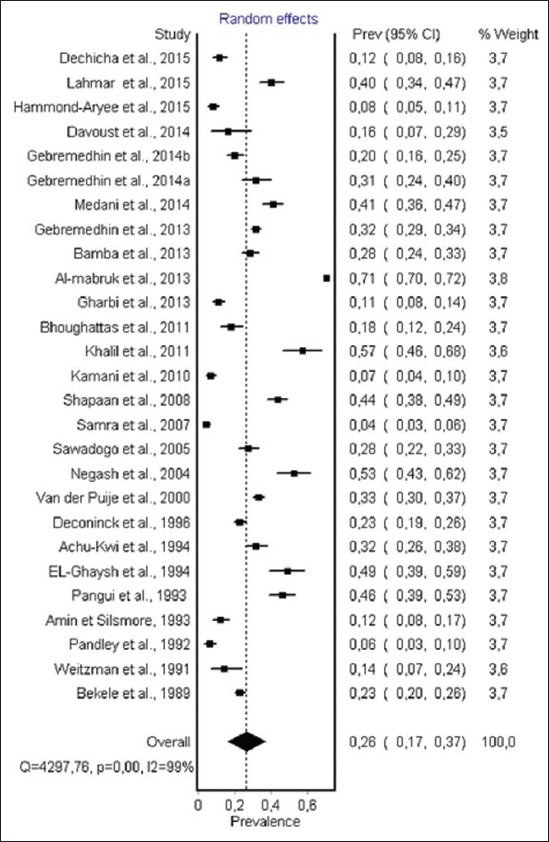
Figure-3.

Forest plot of Toxoplasma gondii infection prevalence in sheep (random effect model). In a forest plot, each study is represented by a line, the width of the line represents the confidence intervals for effect estimate of each study, and area of the box indicates the weight given to each study. This description of forest plot is applied to all forest plots presented in Figures-3-8.
