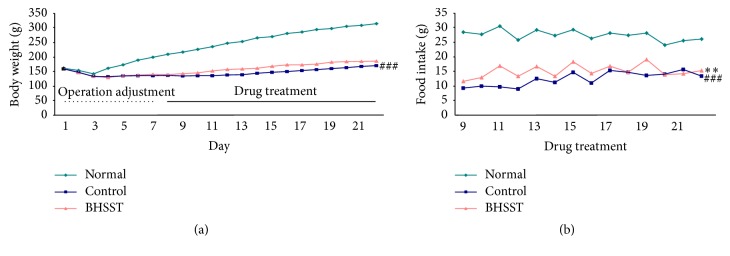
Figure 1.
Body weight changes in the whole experimental periods (a) and food intake changes in the drug treatment periods (b) in chronic acid reflux esophagitis rats. Normal, normal rats; Control, chronic acid reflux esophagitis rats; BHSST, BHSST 1 g/kg body weight/day-treated chronic acid reflux esophagitis rats. Data are mean ± SEM (n = 7). Significance: ###P < 0.001 versus normal rats and ∗∗P < 0.01 versus control rats.

