
Figure 2.
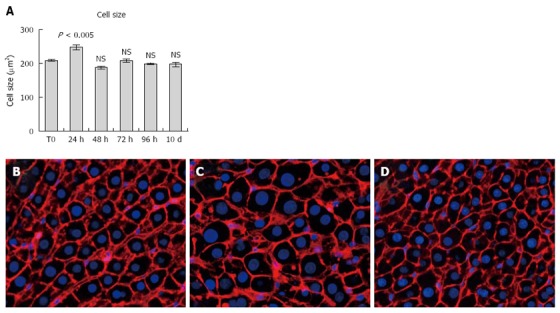
Hepatocyte size during the regenerative response to partial surgical hepatectomy. A: Reporting mean area of hepatocytes in control rat liver and at various time points after PH. At least five hundred hepatocytes per animal in each group were scored. Data are mean ± SE of 5 animals per group. Immunofluorescent staining for Phalloidin is shown in panels B (control rat liver), C (24 h post-PH) and D (10 d post-PH). Nuclei were counterstained with DAPI. PH: Partial surgical hepatectomy.