
Figure 2.
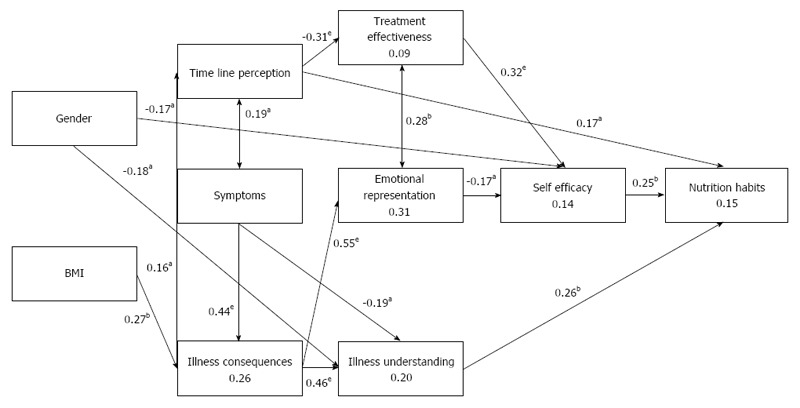
Path model for the study variables predicting nutritional habits. Values attached to the arrows represent regression standardized coefficients (β values), with significance levels in asterisks. Values within the rectangles represent the explained variance by the variable (R2). NFI = 0.870, NNFI = 0.985, CFI = 0.992, RMSEA = 0.018, χ2(29) = 30.413, P = 0.394. aP < 0.05, bP < 0.01, eP < 0.001 NFI: Normal fit index; NNFI: Non-normal fit index; CFI: Comparative fit index; RMSEA: Root mean standard error of approximation.