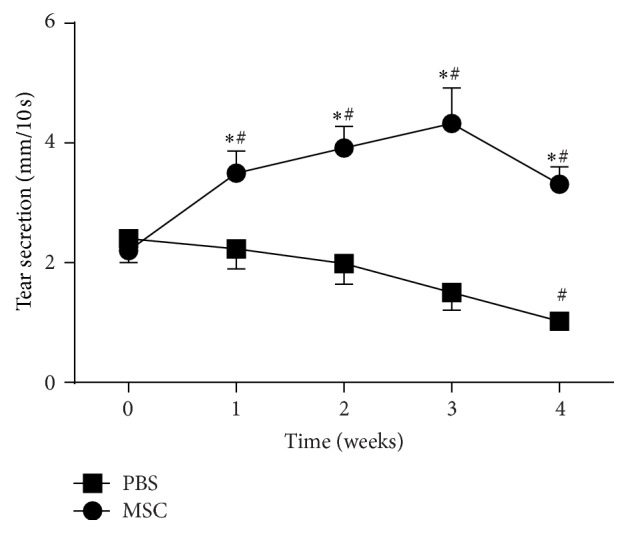
Figure 1.

Aqueous tear production in BD-MSC treated and nontreated NOD mice. At baseline (week 0) and every week posttreatment (for 4 weeks), tear production in BD-MSC treated and PBS (control) treated mice was measured for 10 seconds using phenol red impregnated cotton threads. For statistical analyses each eye was considered separately and the data are presented as means ± SEM (n = 20 for each group). ∗ denotes statistically significant difference compared to control; # denotes statistically significant difference compared to baseline.
