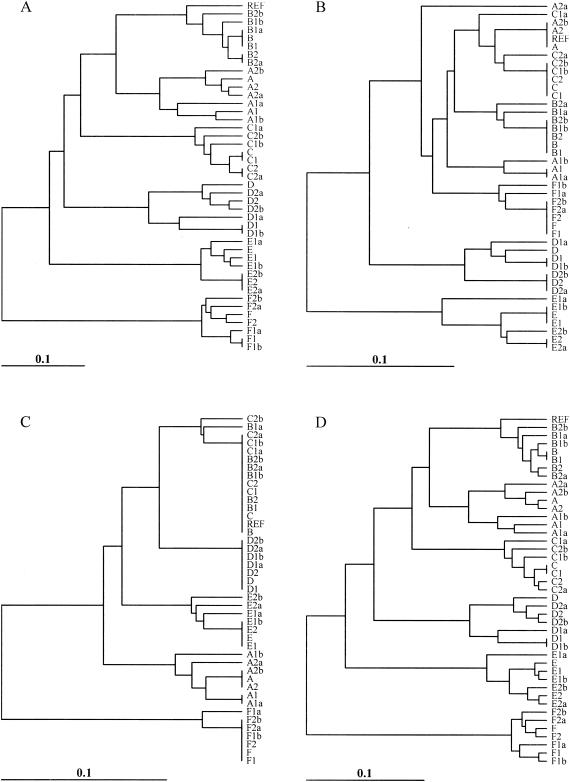
FIG. 6.
Dendrograms depicting the relatedness of the ecological population of isolates and perfect matching. The four different analyses included digestion of the REST data set with XbaI (A); digestion of the REST data set with NotI (B); digestion of the REST data set with SfiI (C); and digestion of the REST data set with XbaI, NotI, and SfiI (D). Relationships are based on the matrices of band-sharing similarity coefficients among isolates, and the dendrogram was generated by UPGMA clustering. REF, reference isolate.

