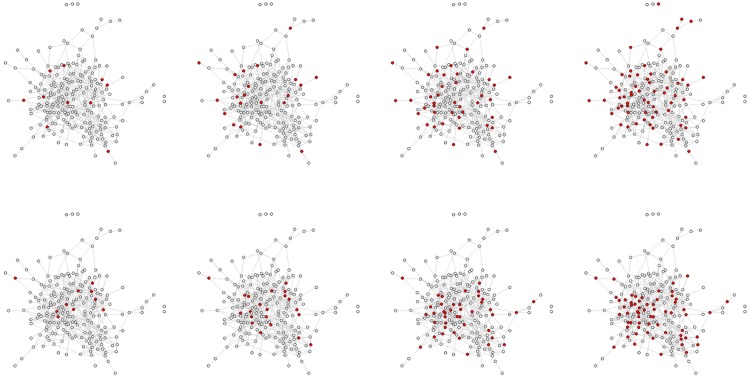
Figure 2.
This figure displays a network map of a real village with 206 inhabitants in Honduras. The top row displays individuals selected at random (in red); the bottom row displays individuals selected by the ‘friendship nomination’ technique (they are a single randomly chosen friend of the randomly chosen individuals) (also in red). The columns display 5, 10, 20 and 30% targeting from left to right. It is apparent that (1) at the same percentage, friends of randomly chosen individuals are more central in the network and have higher degree than the random individuals, and (2) that, as the sampling fraction rises, the difference between the random nodes and the friends nodes declines (as is expected given network theory).

