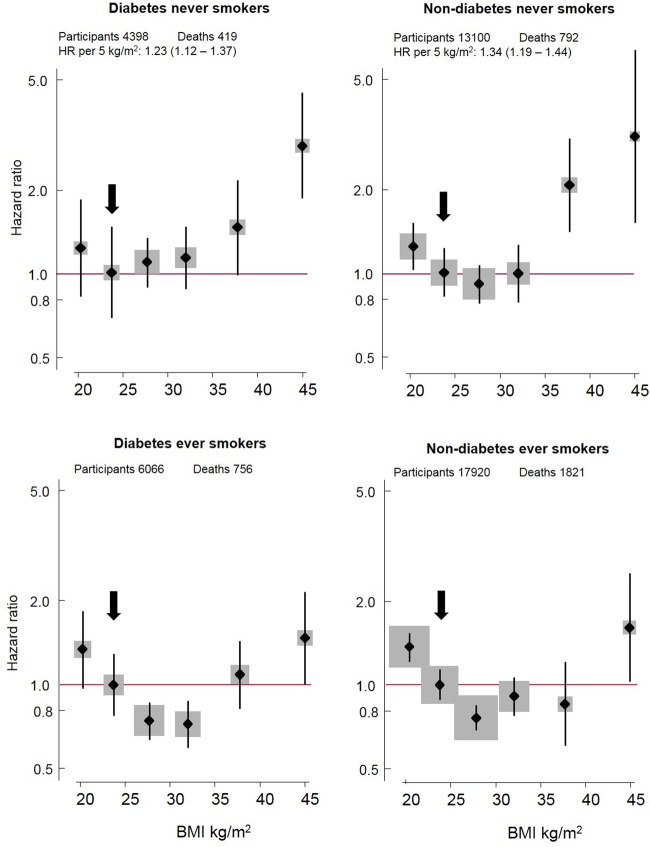
Figure 2.
Association of body mass index with all-cause mortality in diabetes and non-diabetes populations, by smoking status. Boxes are plotted against the mean body mass index (BMI) in each group using floating absolute risk models. The vertical lines represent absolute risk CIs. Sizes of box are proportionate to number of participants per category; proportionality is retained across the populations. Arrow indicates referent category. The HR per 5 kg/m2 higher BMI and its 95% CI are calculated (using Cox modeling) for BMI more than 25 kg/m2, restricted to never smokers.

