
Figure 2.
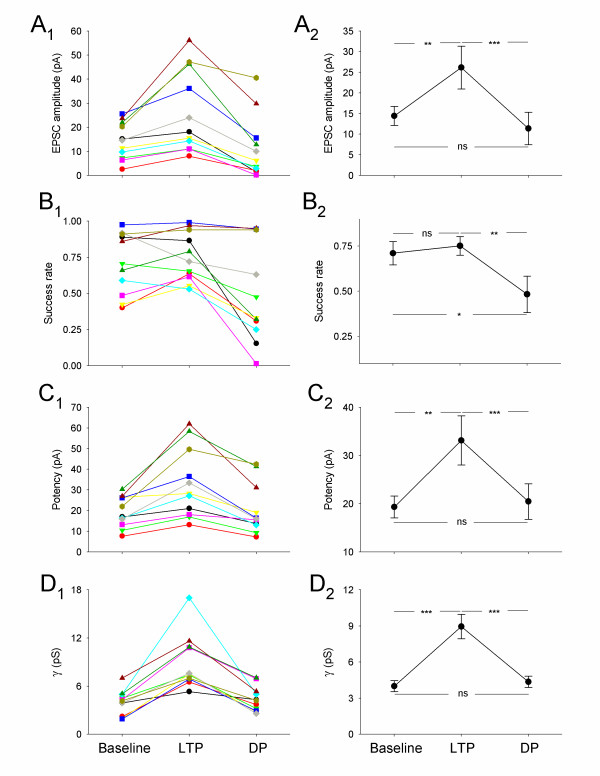
Summary data for all cells that exhibited DPγ. (A) Changes in mean EPSC amplitude for (A1) individual experiments, and (A2) pooled data. (B – D) Similar plots for (B1 & B2) success rate (1 – failure rate), (C1 & C2) potency and (D1 & D2) γ. In this, and Figure 4, ns = not significant, * P < 0.05, ** P < 0.01, *** P < 0.001).