
Figure 6.
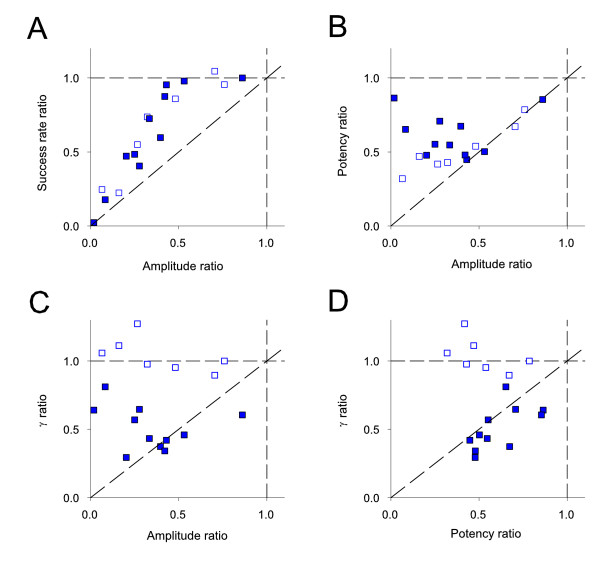
Further analysis of DP experiments. (A) Success rate ratio (DP / preceding LTP) vs. amplitude ratio for individual DP experiments (open symbols represent experiments for which γ did not change, closed symbols for experiments in which there was a change in γ). These symbol codes apply to the rest of the figure. (B) Potency ratio vs. amplitude ratio. (C) γ ratio vs. amplitude ratio. (D) γ ratio vs. potency ratio.