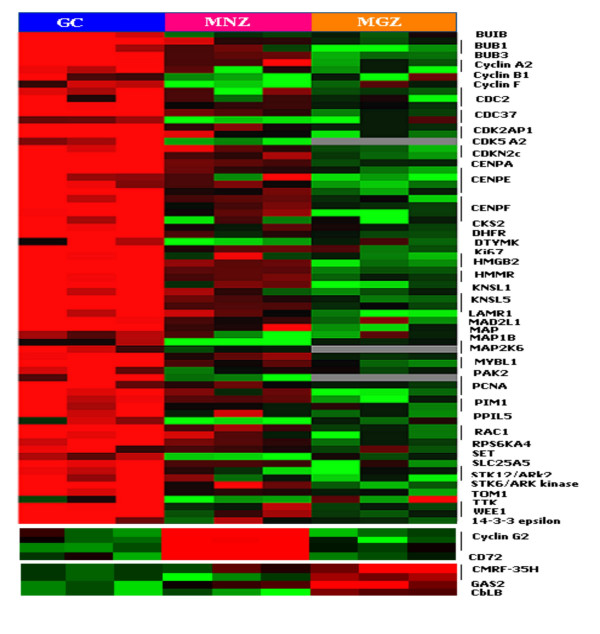
Figure 5.
Cell proliferation and quiescence. Differential gene expression among B-cell compartments. Genes identified in SAM analyses were merged according to functional or operational categories and visualized in Tree View. Color changes within a row indicate expression levels relative to the median of the sample population. Only transcripts differing 2-fold or more in their magnitude than the median or mean of the other two compartments are shown.

