
Figure 4. Imaging cytometry analysis.
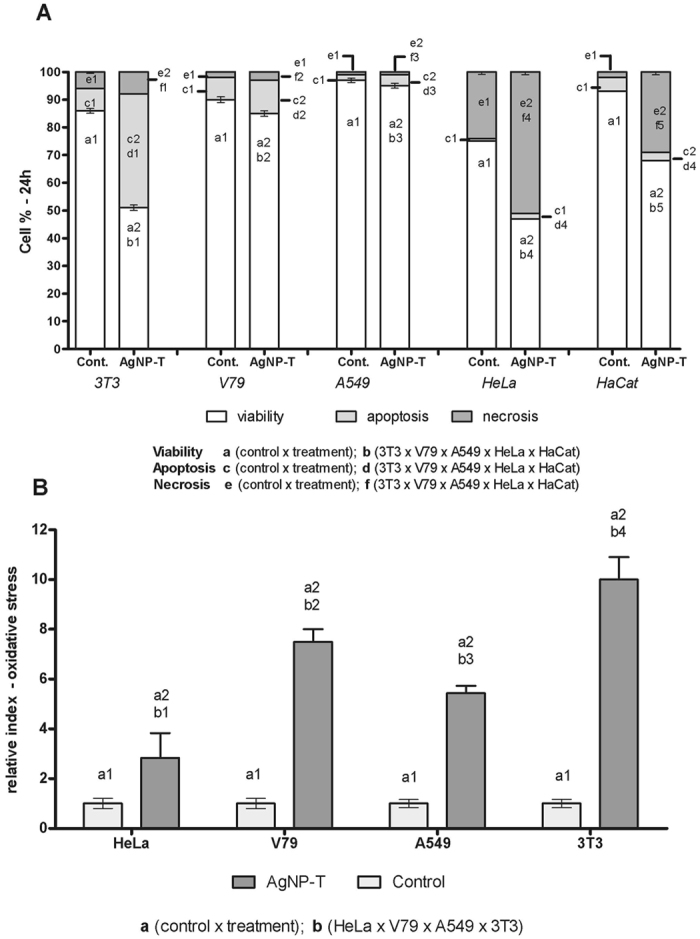
(A) Cell viability, apoptosis and necrosis of the 3T3, V79, A549, HeLa, and HaCaT cell lines exposed to 0.93 × 10¹² NPs/mL of biogenic silver nanoparticles (AgNP-T) for 24 h at 37 °C. (B) Relative oxidative stress index for the 3T3, V79, A549 and HeLa cells exposed to AgNP-T at a concentration of 0.93 × 10¹² NPs/mL for 1 h at 37 °C. Different letters indicate different comparisons and different number indicate significant statistical differences (p < 0.05).