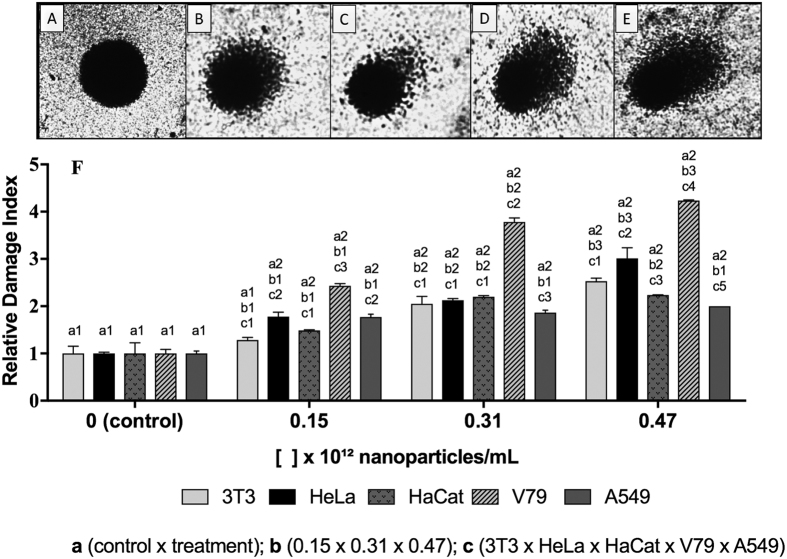
Figure 5. Analysis of DNA damage using the comet test applied to 3T3, HeLa, HaCaT, V79 and A549 cells exposed to the biogenic silver nanoparticles (AgNP-T) for 1 h at 37 °C.
Scores: (A) 0; (B) 1; (C) 2; (D) 3; (E) 4 (100x magnification), where 0 indicates absence of damage and 4 indicates maximum damage; (F) Relative damage indices for AgNP-T at different concentrations and using different cell lines. Different letters indicate different comparisons and different numbers indicate significant differences (p < 0.05).

