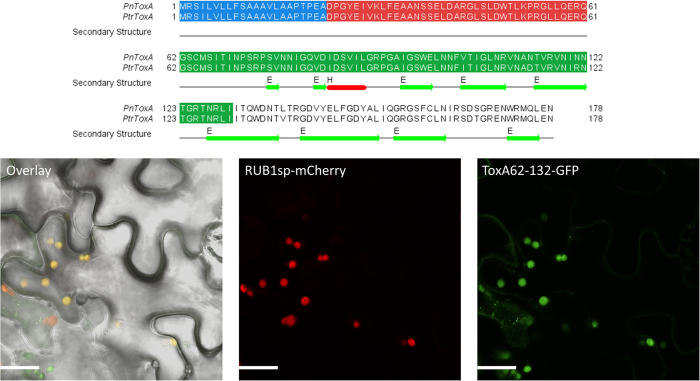
Figure 3. The sequence that was tested for chloroplast localization for PnToxA (Parastagonospora nodorum) is shown in green in the alignment.
The signal peptide and pro-domain are shown in blue and red, respectively. The secondary structure from PtrToxA (PDB entry 1zle) is also shown. Confocal images demonstrating the chloroplast localisation of ToxA62–132-GFP when transiently expressed in the pavement cells of N. benthamiania leaves. The left panel displays the transmitted light image overlayed with the ToxA62–132-GFP and RUB1sp-mCherry fluorescence. The middle panel displays the RUB1sp-mCherry fluorescence (chloroplast marker) whilst the right panel displays the ToxA62–132-GFP fluorescence. Scale bar = 20 μm.

