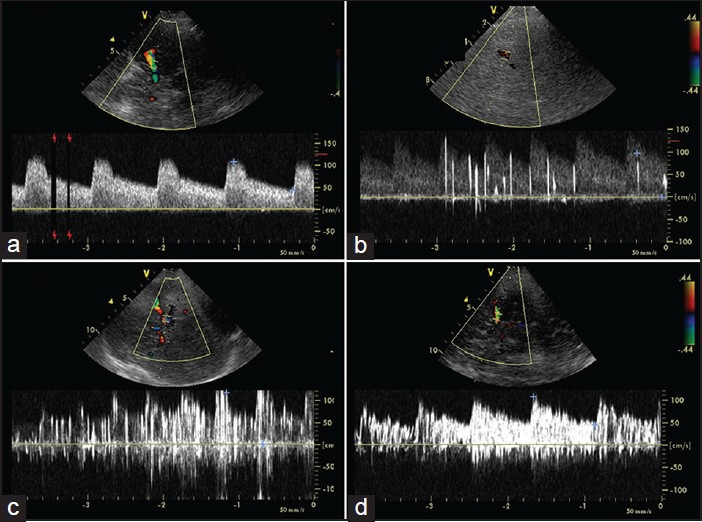
Figure 3.

Paradoxical shunt quantification by contrast transcranial Doppler (TCD) based on the number of microembolic signals (MES): a) 0 MES, no shunt; b) 0-10 MES, small shunt; c) 10-20 MES, medium shunt; d: large shunt (> 20 MES) with “curtain effect”
