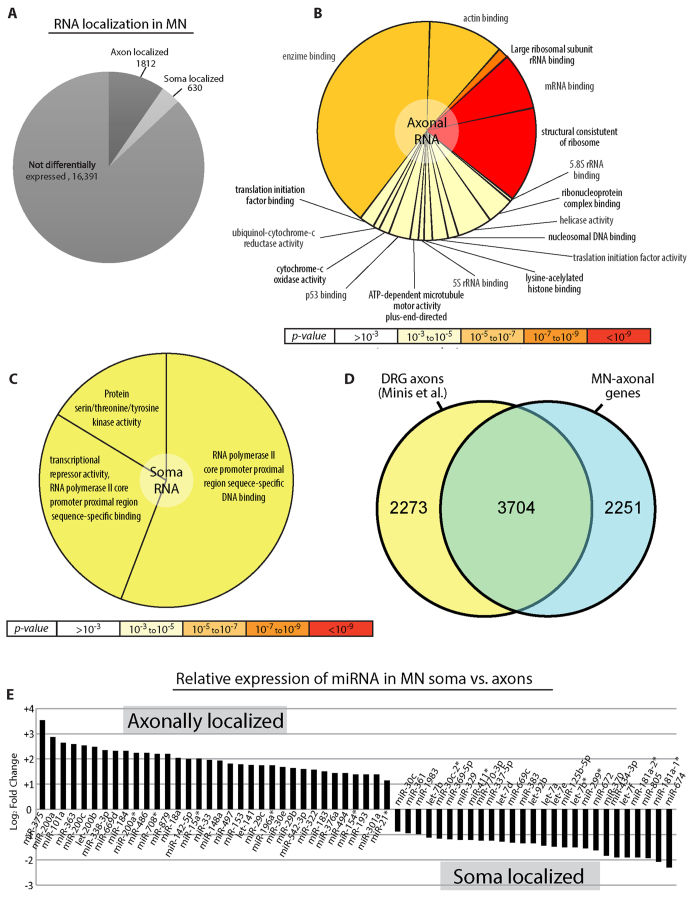
Figure 2. Endogenous axonal RNA.
(A) Pie diagram of axon-localized RNA species [FC > 2, p-value < 0.05], soma-localized RNA species [FC < 0.5, p-value < 0.05] and RNA not showing differential expression [0.5 < FC < 2 and/or p-Value > 0.05]. (B) Axon-localized RNA GO categories. Color is based on significance; the number of genes associated with each category is represented by the size of the pie slice. (C) Soma-localized RNA GO categories. Color is based on significance; the number of genes associated with each category is represented by the size of the pie slice. (D) Venn diagram comparing all of the genes identified in DRG axons by Minis et al. (FPKM > 10) with all of the genes identified from motor neuron axons via deep-seq (normalized expression > 400). (E) MicroRNA expression profile within control neurons [axonal: FC > 2, p-value < 0.05, Somatic: FC < 0.5, p-value < 0.05].

