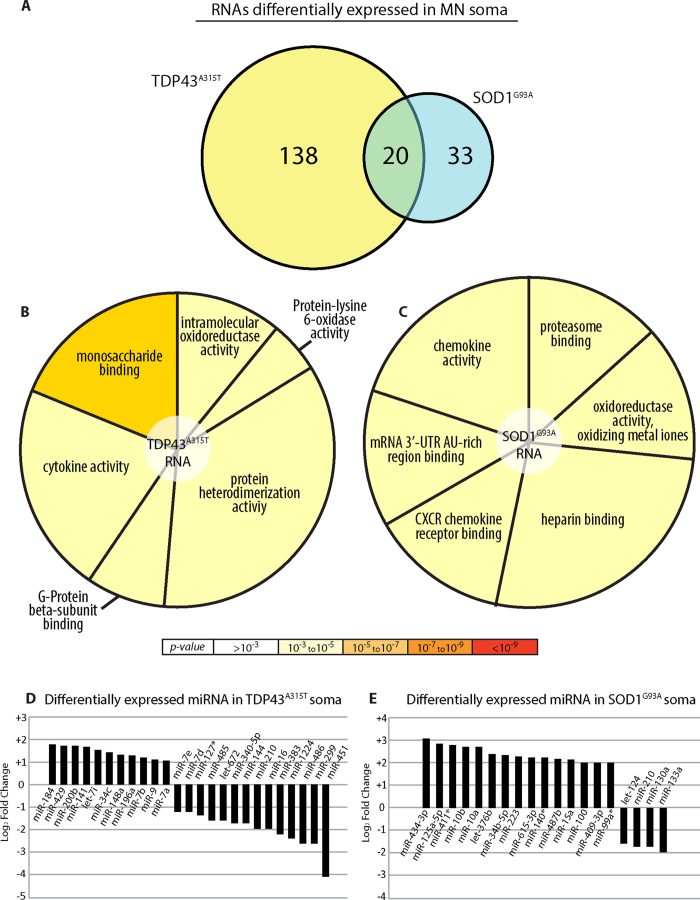
Figure 4. ALS models - somatic RNA.
(A) Comparing genes showing differential expression in the somas of the SOD1G93A and TDP43A315T ALS models compared to GFP-expressing neurons [above median expression, FC > 2 or FC < 0.5, p-value < 0.05]. (B) TDP43A315T differentially expressed genes GO analysis pie chart. Color is based on significance; the number of genes associated with each category is represented by the size of the pie slice. (C) SOD1G93A differentially expressed genes GO analysis pie chart. Color is based on significance; the number of genes associated with each category is represented by the size of the pie slice. (D) TDP43A315T differentially expressed miRNA compared to GFP-expressing somas (p-value < 0.05). (E) SOD1G93A differentially expressed miRNA compared to GFP-expressing somas (p-value < 0.05).

