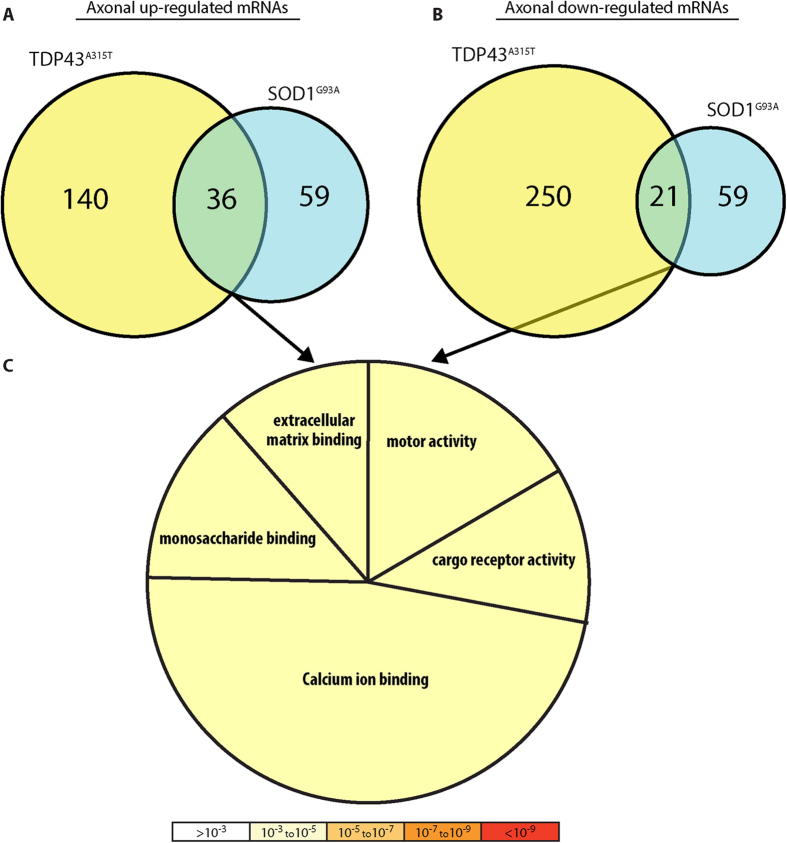
Figure 5. ALS models - axonal mRNA.
(A) Comparison of genes up regulated (above median expression, FC > 2) in axons of the SOD1G93A and TDP43A315T ALS models compared to GFP-expressing neurons. (B) Comparison of genes down-regulated (above median expression, FC < −2) in axons of the SOD1G93A and TDP43A315T ALS models compared to GFP-expressing neurons. (C) Pie chart of GO categories associated with differentially expressed genes in A,B. Color is based on significance; the number of genes associated with each category is represented by the size of the pie slice.

