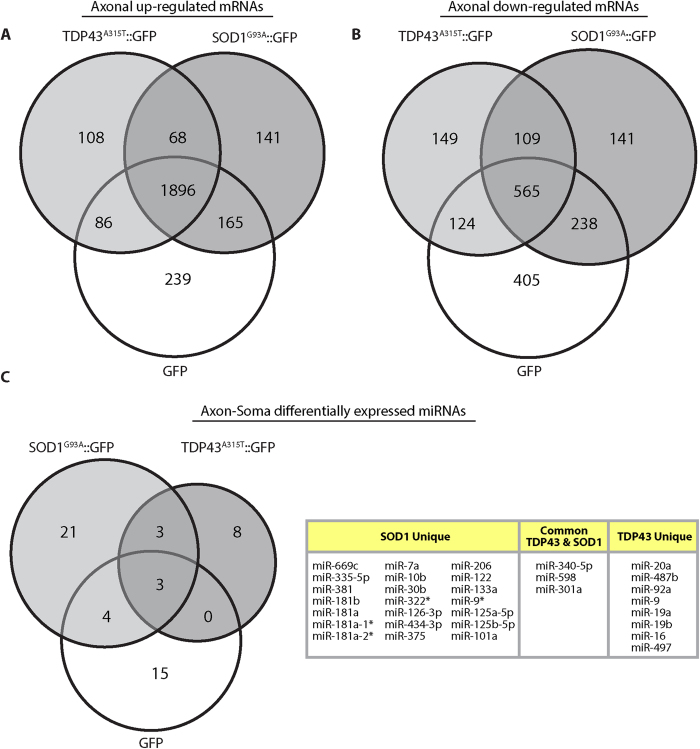
Figure 7. Axon vs. Soma in ALS.
(A) Venn diagram of genes up-regulated (FC > 2, FDR q-value < 0.05) in axons relative to somas in ALS model cultures compared to axonally up-regulated genes in GFP cultures. (B) Venn diagram of genes down-regulated (FC < −2, FDR q-value < 0.05) in axons relative to somas in ALS model cultures compared to genes down-regulated in axons in GFP cultures. (C) Venn diagram and table of microRNAs showing axon-soma differential expression (FC > 2 or FC < 0.5, p-value < 0.05) in ALS model cultures compared to differentially expressed microRNAs in GFP cultures.

