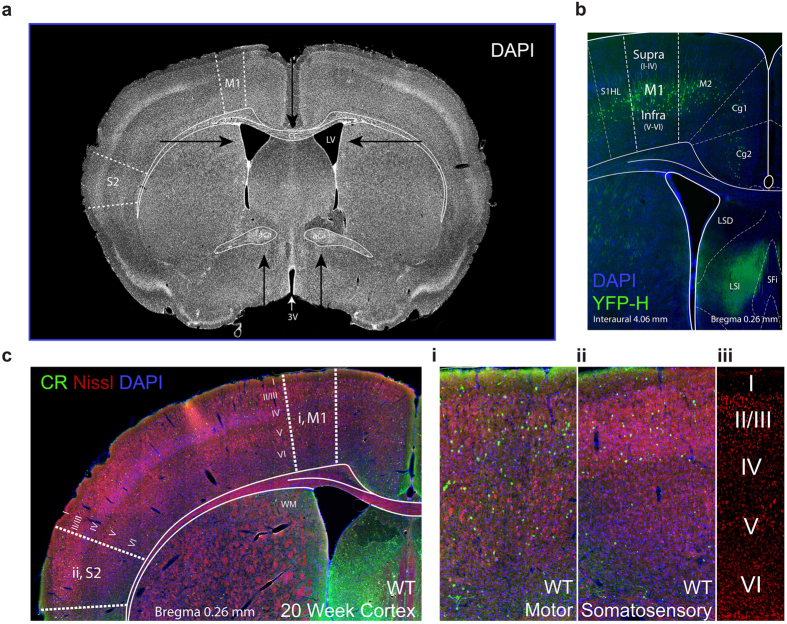
Figure 1. Representative images of sections used for quantitative analysis in WT and SOD1G93A mice.
Coronal sections, each 40 μm thick, from bregma 1.18 to −0.58 were used for quantitative analysis at four stages of disease progression in each cohort of mice. (a) An example section used in the study (Interaural 4.06 mm, Bregma 0.26 mm) with primary motor (M1) and secondary somatosensory (S2) regions denoted by dotted lines. Arrows indicate anatomical landmarks used to identify regions of interest, as visualised by DAPI staining: namely, the namely the third (3 V) and lateral ventricles (LV), shape and appearance of the corpus callosum (cc) and anterior commissure (aca). (b) The motor cortex imaging site as validated in the Thy1-eYFP-H mouse, which has particularly prominent yellow fluorescent protein expression in large layer V corticospinal neurons (green) within the motor cortex57,80. (c) A representative image of a calretinin (green), Nissl (red), DAPI (blue) cortical coronal section used for analyses. In each section, the motor (i) and somatosensory (ii) regions of interest (boxed areas enlarged to the right) were used for quantitative analyses, with cortical layers I–VI visualised by Nissl staining (iii).

