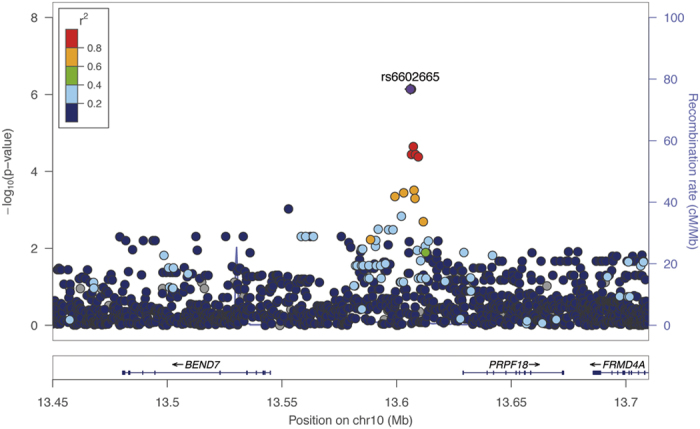
Figure 3. Regional plot of association results in the discovery stage for the BEND7/PRPF18 intergenic region, a novel locus for skin pigmentation.

The statistical significance of association results (-log10 p-value) is represented for each SNP as a dot (y-axis) by chromosome position (x-axis). The top hit (rs6602665) is represented by a diamond and remaining SNPs are colour coded based on their LD with this SNP, indicated by pairwise r2 values for American populations of the 1KGP.
