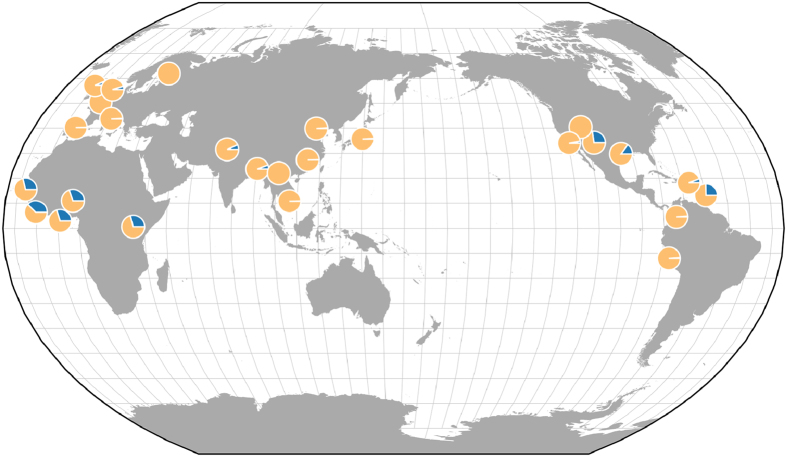
Figure 4. Allele frequency map for rs6602666, the most significant meta-analysis SNP from the intergenic region of BEND7 and PRPF18.
Frequency proportions for the effect (G) and non-effect (A) alleles are represented in dark and light gray, respectively. Obtained from the Geography of Genetic Variants Browser Beta v0.242.

