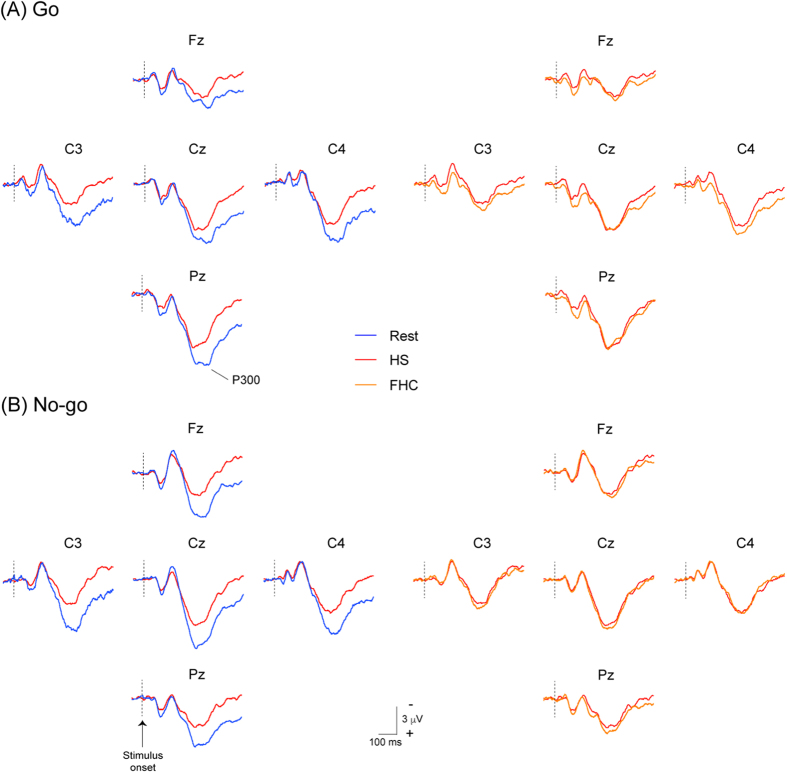
Figure 2. Grand-averaged event-related potentials (ERP) waveforms at five sites (Fz, Cz, Pz, C3, and C4) between the pre-heat baseline (1st session, Rest), during heat stress (3rd session, HS), and during heat stress with face/head cooling (3rd session, FHC) in Go trials (Panel A, upper figures) and No-go trials (Panel B, lower figures).
Blue, red, and orange lines show waveforms in the 1st, 2nd, and 3rd sessions, respectively. The amplitudes of the P300 component in both trials are clearly reduced during HS and remain reduced during FBC.

