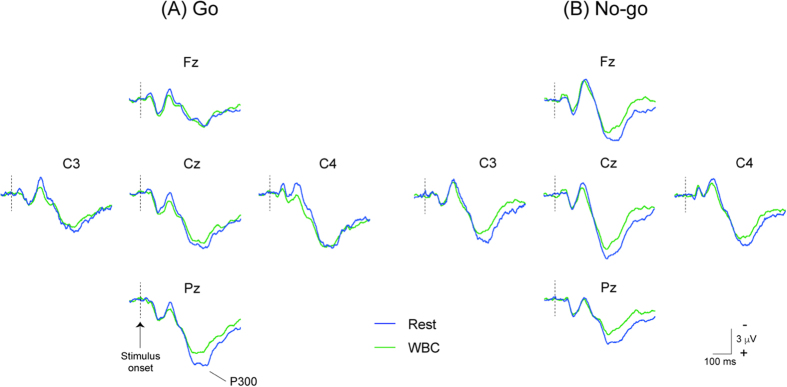
Figure 3. Grand-averaged event-related potentials (ERP) waveforms at five sites (Fz, Cz, Pz, C3, and C4) between the pre-heating baseline (1st session, Rest) and during whole body cooling (4th session, WBC) in Go trials (Panel A, upper figures) and No-go trials (Panel B, lower figures).
Blue and green lines show waveforms in the 1st and 4th sessions, respectively. The amplitudes of the P300 component in the Go trials are similar between the pre-heat baseline (1st session, Rest) and recovery (4th session, WBC), except for Pz, whereas those in the No-go trials remain smaller during WBC than during Rest.

