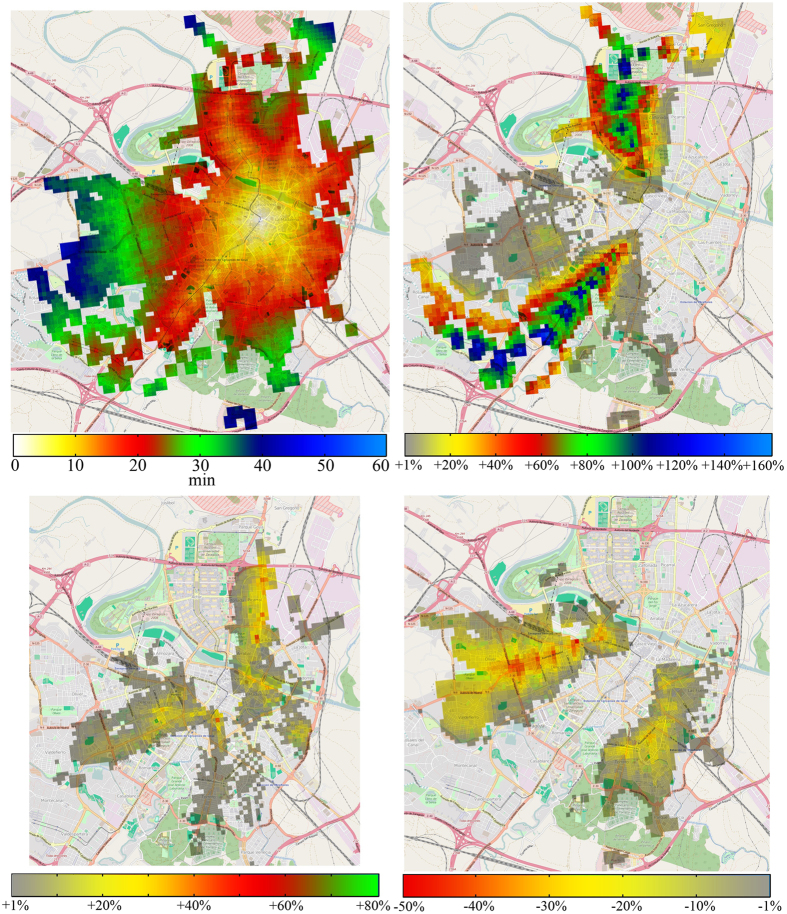
Figure 6. Service disruptions and network improvements.
Top left: average time it takes to get to the city center between 08:30 and 09:00. Top right: difference with the original case when the tram is removed. Bottom left: difference when the 2 most used lines to get to the city center are removed (lines 22 and 35). Bottom right: difference if we add a new tram line. This pictures have being done using tiles from OpenStreetMap. The cartography in the openstreetmap map tiles is licensed under cc by-sa (www.openstreetmap.org/copyright). The license terms can be found on the following link: http://creativecommons.org/licenses/by-sa/2.0/ (Accesed: 1st june 2015). © OpenStreetMap contributors.

