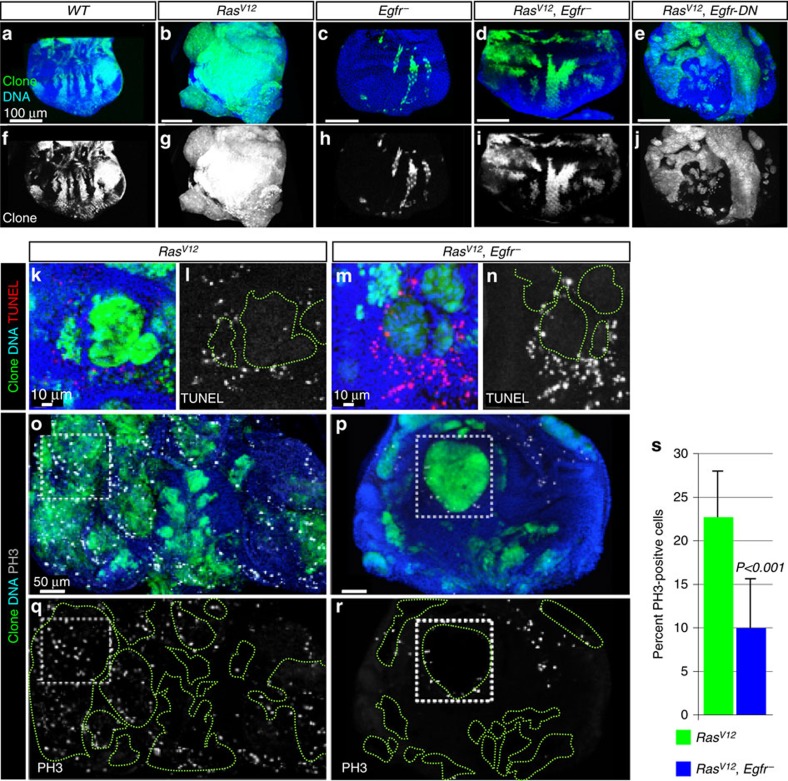
Figure 1. Egfr− suppresses RasV12 tumour overgrowth by inhibiting cell proliferation.
(a–j) Images of eye discs containing GFP-labelled wild-type or RasV12 or Egfr− single mutant or RasV12, Egfr− or RasV12, Egfr-DN double mutant clones dissected from wondering third-instar animals raised at 25 °C. Images represent a projection of the top 10 μm for each genotype. RasV12 clones (b) overgrow to form large contiguous tumours compared with control clones (a). The Egfr− mutation yields small clones (c) and suppresses the growth of RasV12 clones (d). Expression of a dominant version of Egfr (Egfr-DN) similarly suppresses RasV12 tumour growth (e). Respective GFP (clones) channels are shown in the bottom panels (f–j). (k–n) Representative images showing terminal deoxynucleotidyl transferase (TdT) dUTP nick-end labelling (TUNEL) of RasV12 or RasV12, Egfr− double mutant clones to detect apoptotic cells. RasV12, Egfr− double mutant clones (m,n) do not show ectopic cell death compared to RasV12 clones (k,l). (o–r) Representative eye discs showing RasV12 (o) or RasV12, Egfr− double mutant (p) clones stained with anti-phosphohistone3 (PH3) antibodies to detect mitotic cells. Boxed areas are shown for comparison. Individual PH3 channels are shown in q,r. (s) Quantitation of o–r. The number of PH3-positive over total number of cells was scored in multiple clones across several animals for each genotype. The Egfr− mutation reduced the percentage of proliferative cells (Mean±s.d.%, N, P: 9.97±5.6%, N=1,693 cells from 7 discs, P<0.001 versus 27.7±5.2%, N=2,100 cells from 11 discs for RasV12 and RasV12, Egfr− double mutant cells, respectively). Error bars represent standard deviation (s.d.) from the mean for each genotype analysed. P is derived from t-test analyses and N denotes the sample size.

