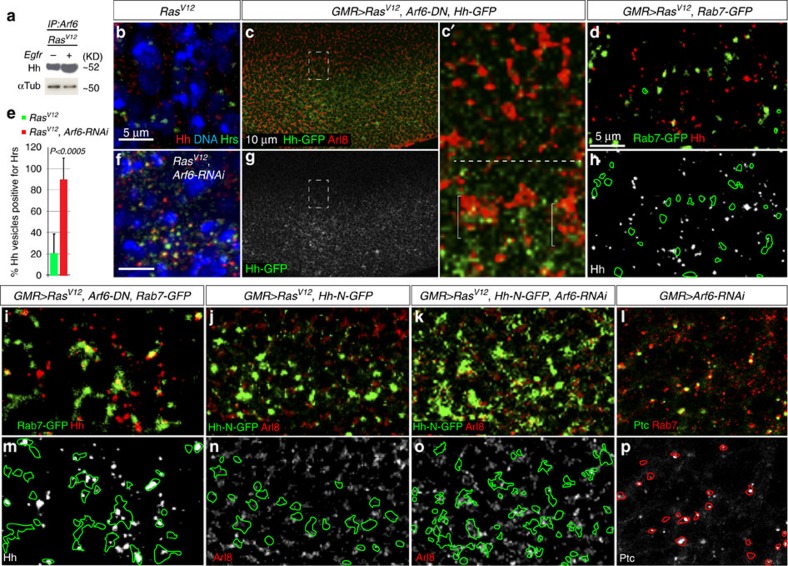
Figure 5. Arf6 controls Hedgehog cellular trafficking.
(a) Protein lysates derived from dissected wild-type discs or discs with RasV12 tumours were used in western-blotting experiments to detect full-length (active) Cubitus interuptus (Ci) protein levels against the loading control (α-tubulin). Hh co-precipitates with Arf6 but the Egfr− mutation interferes with Arf6's ability to interact with Hh. (b,f) RasV12 or RasV12, Arf6-RNAi co-expressing cells stained with anti-hedgehog, anti-Hrs antibodies and DAPI (4,6-diamidino-2-phenylindole). Distinct Hh (red) or Hrs (green)-positive vesicles are detected in RasV12 cells (b). In contrast, Hh predominantly localizes to Hrs-positive vesicles in RasV12, ARF6-RNAi co-expressing cells (f). (c) Eye disc co-expressing Hh-GFP, RasV12 and Arf6-DN under the control of GMR-GAL4 and stained against Arl8. The Hh-GFP channel alone is shown in g. Higher magnification image of posterior/anterior boundary (boxed area) is shown in c'. Hh-GFP localizes to clusters of Arl8-positive vesicles specifically in the posterior portion of the eye disc (brackets), but not in the anterior region of the eye (above the dotted line). (d,h,l,m) Images from eye disc co-expressing either RasV12 and Rab7-GFP (d,h) or RasV12, Arf6-DN, and Rab7-GFP (i,m) using GMR-GAL4 and stained with anti-Hh antibodies. Images of the Hh channel for d,i are shown in h,m, respectively. Fluorescent signal contours of Rab7-GFP (m) and Hh-N-GFP (n,o) are shown in m–o. (e) Quantitation of Hh punctae localizing to Hrs-positive vesicles. The total number of Hh punctae in RasV12 or RasV12, Arf6-RNAi co-expressing cells (N=27 and 32, respectively) was scored for each genotype and the respective percentage of Hh localizing to Hrs-positive vesicles was determined. (j,k) Images from an eye disc co-expressing RasV12 and the secreted form of Hh (Hh-N-GFP) alone (j) or in the presence of Arf6-RNAi (k) and stained with anti-Arl8 antibodies. The respective Arl8 images are shown in the bottom panels n,o. (l) Image from an eye disc expressing Arf6-RNAi with GMR-GAL4 and stained against patched (ptc) and Rab7. The corresponding patched channel is shown alone in p. Rab7 fluorescent signal contours are shown in p. P is derived from t-test analyses and N denotes the sample size.

