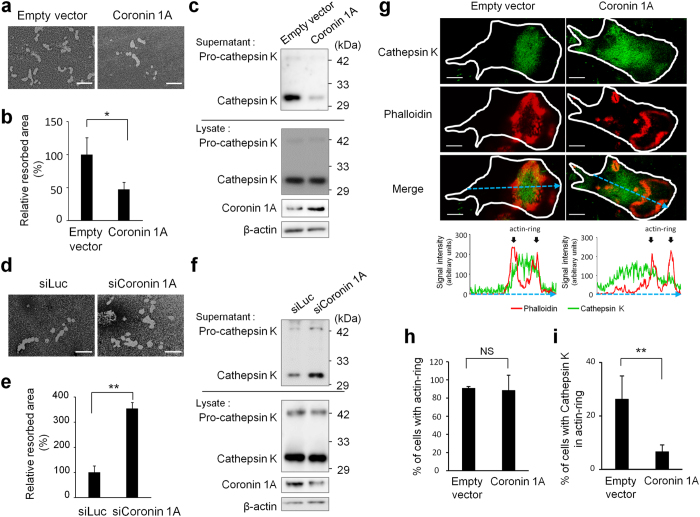
Figure 3. Coronin 1A inhibited bone resorption in osteoclasts.
(a–c,g–j) BMMs were transduced with empty vector- (control) or coronin 1A-expressing lentivirus, and then were cultured with M-CSF (10 ng/mL) and RANKL (50 ng/mL) to differentiate into osteoclasts. (a,b) Osteoclasts were removed from the bone biomimetic synthetic surface plate and resorption pit areas were visualized by von Kossa staining. The bone resorption areas were analysed by using the MetaMorph software. Data are means ± SD of three independent experiments. *P < 0.05 for the indicated comparisons. Scale bars, 50 μm. (c) The amount of cathepsin K in cell lysates and supernatants. Cell lysates and supernatants were analysed by immunoblotting. Unprocessed original scans of blots are shown in Supplementary Fig. 10. (d–f) BMMs were transfected with luciferase- or coronin 1A-specific siRNA, and then were incubated with M-CSF and RANKL. (d,e) Bone resorption activity of control and coronin 1A knockdown cells. The resorption areas were analysed by using the MetaMorph software. Data are means ± SD of three independent experiments. **P < 0.01 for the indicated comparisons. Scale bars, 50 μm. (f) The amount of cathepsin K in cell lysates and supernatants. Unprocessed original scans of blots are shown in Supplementary Fig. 10. (g) Representative confocal images of control- and coronin 1A-overexpressing osteoclasts; actin, red; cathepsin K, green; cell perimeters, white. Scale bars, 20 μm. Graph indicates the intensity profile of the blue dotted line in each image. The blue dotted line passes through the centroid positions of each cell and actin-ring. (h) Percentage of control- or coronin 1A-overexpressing osteoclasts with actin ring; data are presented as mean ± SD, n = 35 in each group. (Student’s t-test). NS: not-statistically significant. (i,j) Percentage of cells with cathepsin K or lysosomal-associated membrane protein 1 (LAMP1) localized in actin-ring of control- or coronin 1A-overexpressing osteoclasts; data are presented as mean ± SD, n = 35 in each group. *P < 0.05, **P < 0.01, (Student’s t-test). Data are representative of three experiments.

