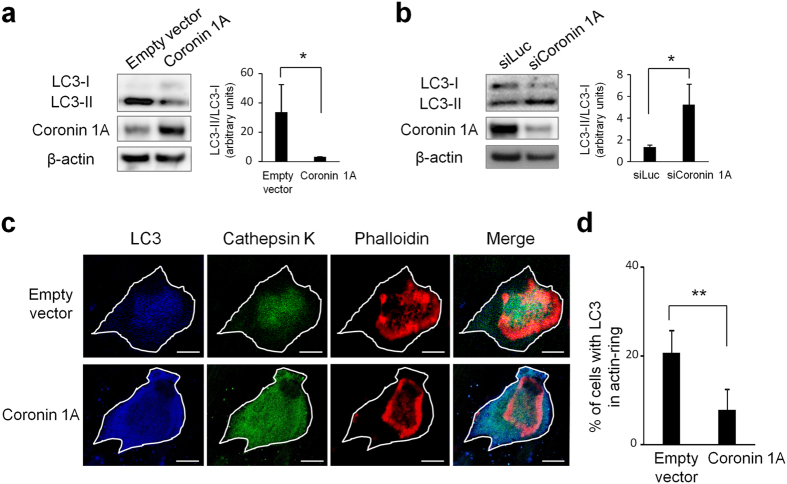
Figure 4. Coronin 1A regulated the lipidation and localization of LC3 in osteoclasts.
(a) The amount of LC3 in cell lysates. Cell lysates of empty vector (control) or coronin 1A-overexpressing osteoclasts were analysed by immunoblotting. Right: The ratio of LC3-II to LC3-I was quantified from three independent experiments using ImageJ. Unprocessed original scans of blots are shown in Supplementary Fig. 11. *P < 0.05, (Student’s t-test). (b) Cell lysates of luciferase- or coronin 1A-knockdown osteoclasts were analysed by immunoblotting. Right: The ratio of LC3-II to LC3-I was quantified from three independent experiments using ImageJ. Unprocessed original scans of blots are shown in Supplementary Fig.11. *P < 0.05, (Student’s t-test). (c) Representative confocal images of control- and coronin 1A-overexpressing osteoclasts; actin, red; LC3, blue; cathepsin K, green; cell perimeters, white. Scale bars, 20 μm. (d) Percentage of control or coronin 1A-overexpressing osteoclasts with LC3 within the actin ring; data are presented as mean ± SD, n = 35 **P < 0.01, (Student’s t-test). Data are representative of three experiments.

