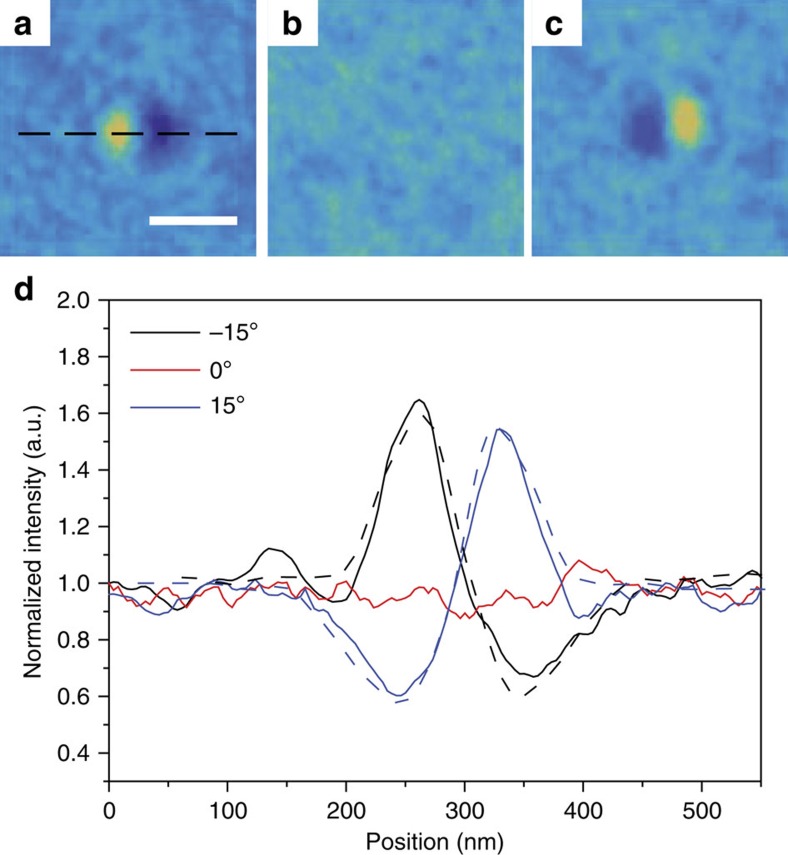
Figure 3. Experimental L-TEM images of a Néel skyrmion at varying tilt angles.
(a–c) Tilt sequence of a magnetic skyrmion with a radius of 90 nm, taken at (a) −15°, (b) 0° and (c) 15° of tilt showing the disappearance of contrast at 0° tilt and reversal of contrast for opposite tilt angles. The tilt axis is indicated by the dashed line in a. Scale bar, 200 nm. (d) Line profiles of the three images, along the direction of the dashed line in a, showing the differences in contrast. The direction of asymmetry (bright-dark or dark-bright) is indicative of the skyrmion polarity. In this case, the imaged skyrmion polarity is +1. The skyrmion extent is determined by the distance between the maximum and minimum for the tilted samples. The dashed lines correspond to simulated intensity profiles of an 86 nm skyrmion, showing good qualitative agreement.

