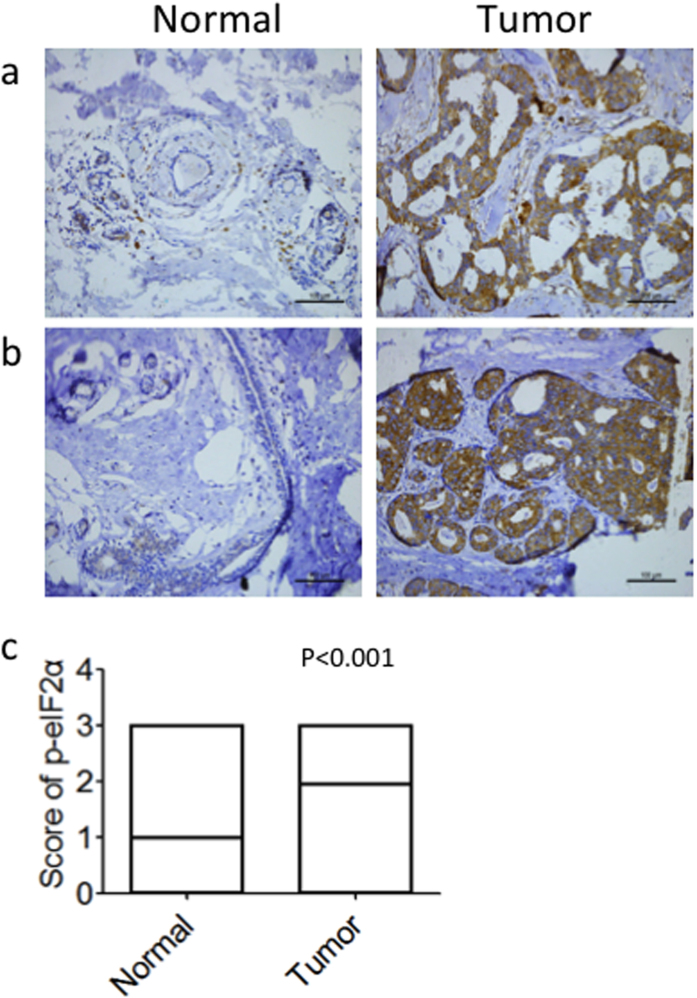
Figure 2. Comparison of p-eIF2α levels between tumor and peritumoral tissues in patients with breast cancer.
Representative staining of p-eIF2α in peritumoral and tumor tissues in two patients is shown. (a,b) Photomicrographs, 200× magnification. (c) Wilcoxon signedrank comparison of p-eIF2α levels between 233 pairs of tumor and peritumoral tissues.

