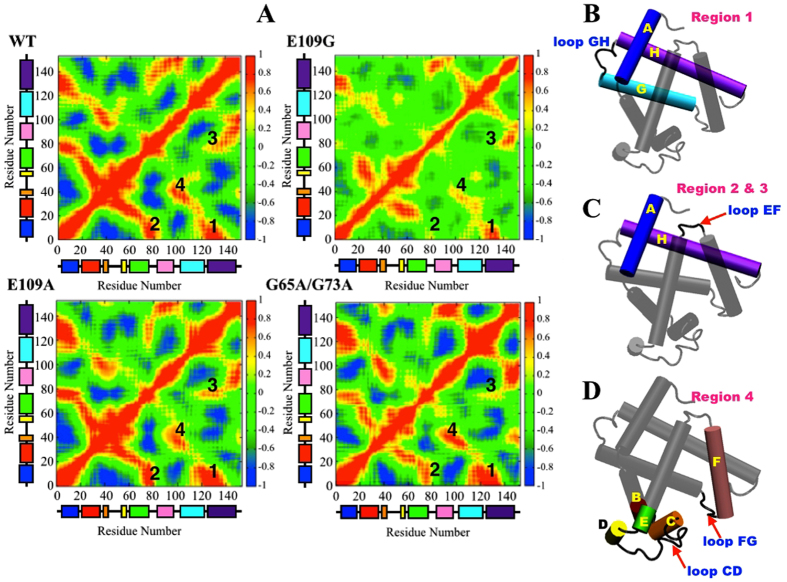
Figure 5.
(A) Correlation map of wild type, E109A, E109G and G65A/G73A with the eight helical domains represented by color coded boxes going from Helix A (blue) to Helix H (purple). Schematic representation of apoMb with the helices and loops involved in (B) Region 1, (C) Region 2 and 3 and (D) Region 4 highlighted.

