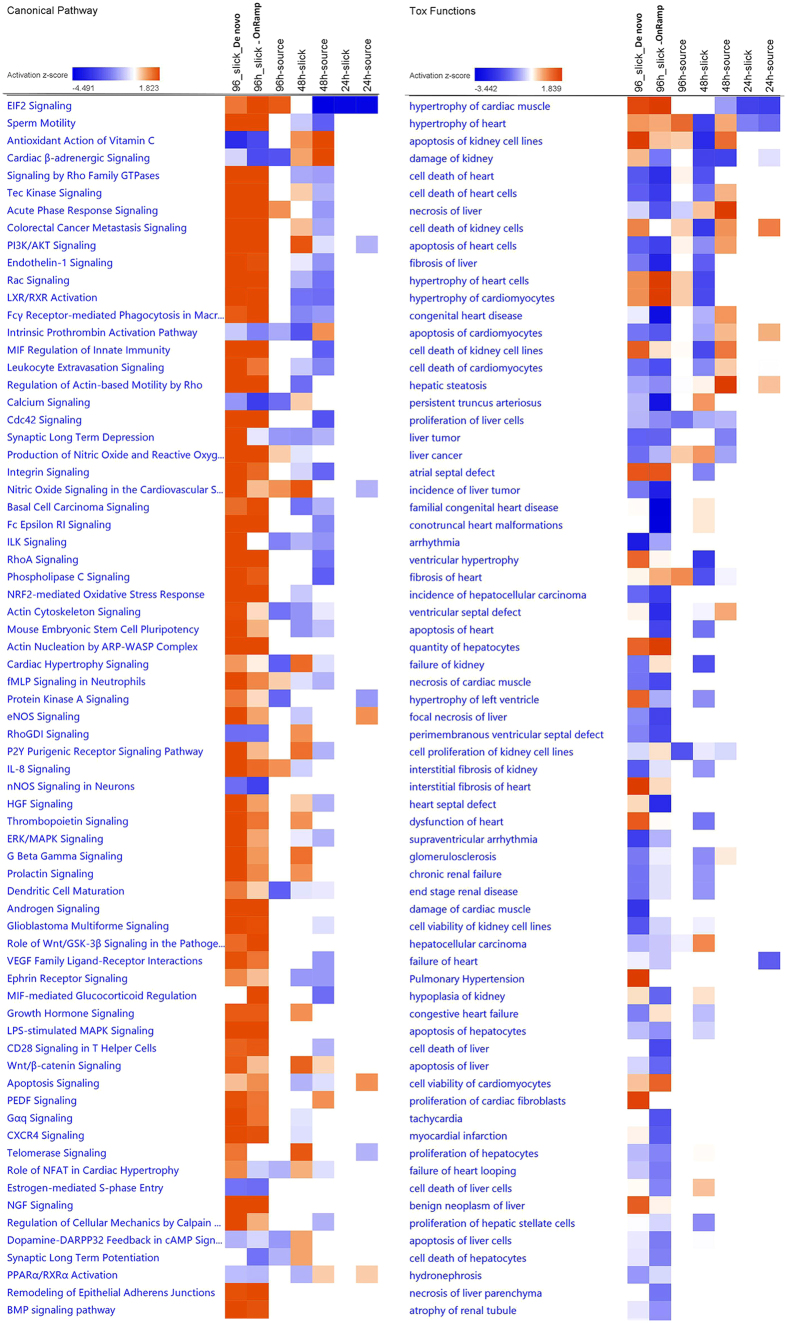
Figure 3. Heat maps clustering de novo (96h_slick) and OnRamp approaches (96h_slick, 96h_source, 48h_slick, 48h_source, 24h_slick, 24h_source) in canonical pathways and tox functions.
Orange indicates the z-score is positive. IPA predicts that the biological process or function is trending towards an increase when Z-scores ≥ 1.3. Blue indicates z-score is negative. IPA predicts that the biological process or function is trending towards a decrease when Z-scores ≤ −1.3.

