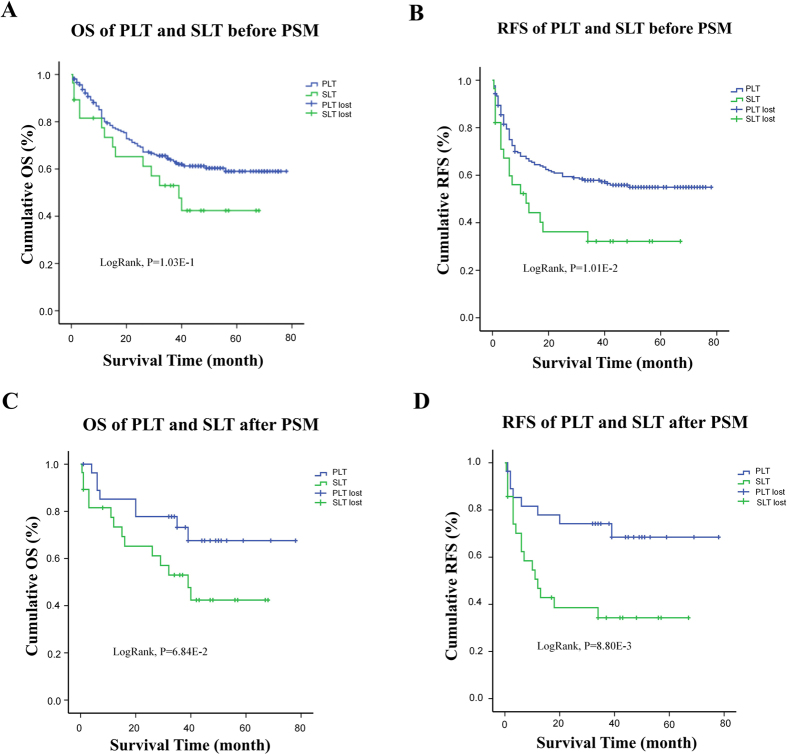
Figure 2. OS and RFS comparison between PLT and SLT group both before and after PSM.
(A) and (B) OS and RFS both have an inferior prone in SLT group than in PLT group, with significance in RFS (LogRank p < 0.05) but not in OS (LogRank p > 0.05). (C) and (D) After PSM, the RFS seem significantly worse in SLT group. In a 1:1 match of 23 pairs, the 1 yr, 3 yr and 5 yr OS rate was 77.89%, 74.18% and 68.47% respectively in PLT group, significantly better than 62.34%, 34.29% and 34.29% in SLT group (LogRank P < 0.05). The OS phenomenon was in the same trend with an almost significance, in a 23 to 23 PSM, with 86.96%, 52.17% and 17.39% respectively in P group and 56.52%, 30.43% and 4.35% in SLT group (LogRank P > 0.05).

