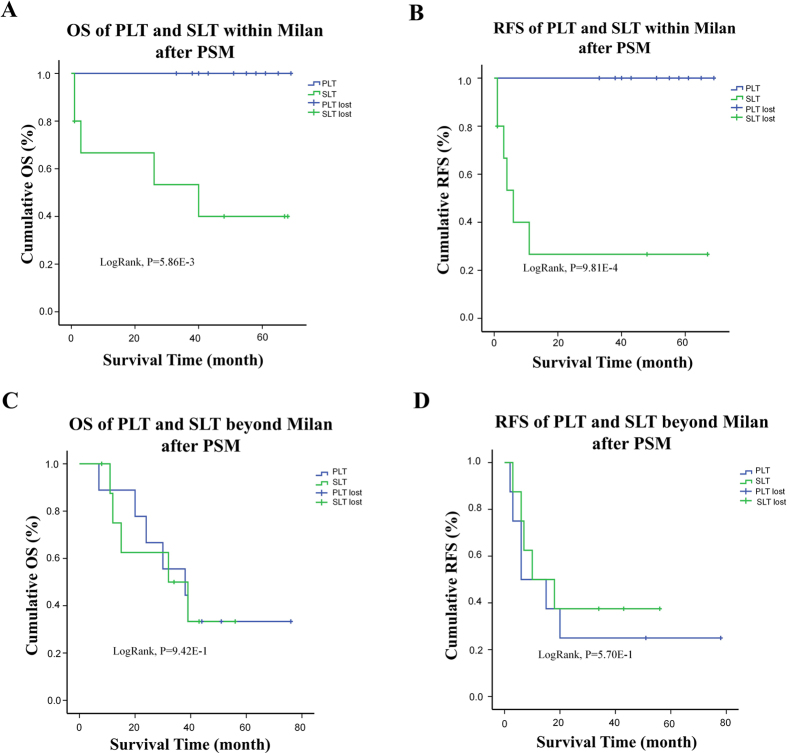
Figure 4. OS and RFS comparison between PLT and SLT group after split by Milan criteria with the use of PSM.
(A) and (B) The significance of deteriorated OS and RFS in SLT group remained after PSM in within Milan group(LogRank p < 0.05) (C) and (D) After PSM, the beyond-Milan group still had no differences between SLT and PLT.

