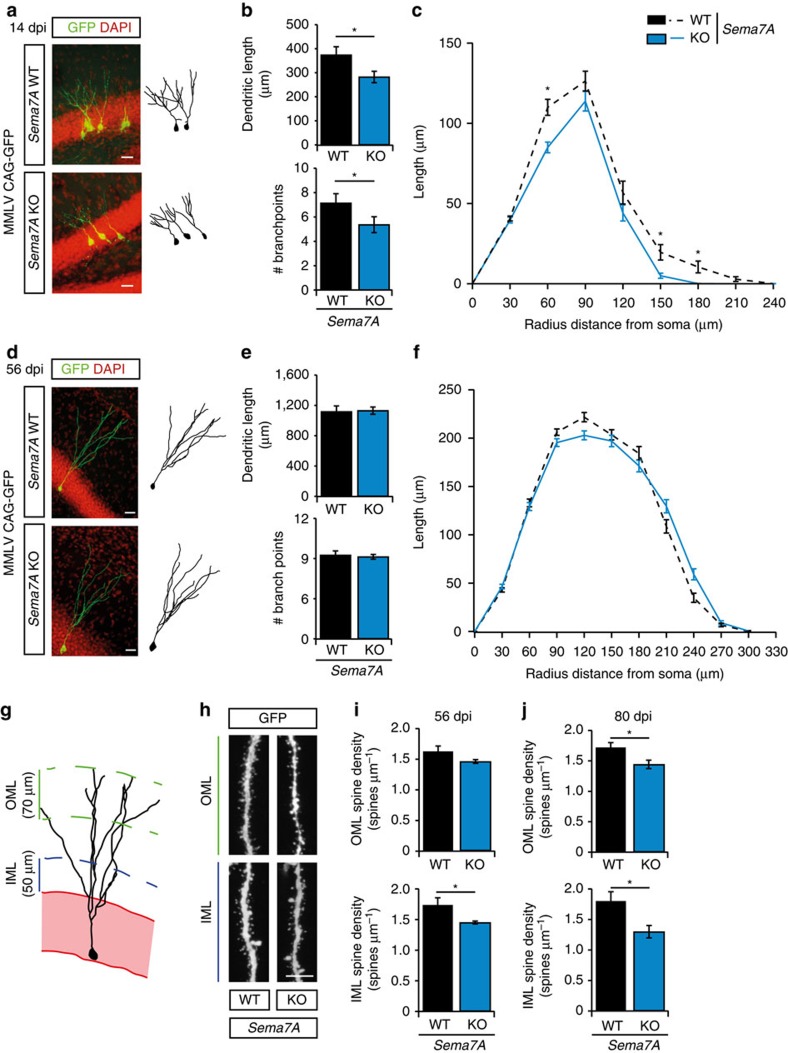
Figure 4. Sema7A is required for dendritic growth and spine development in adult-born DG granule cells.
(a,d) The dentate gyrus of adult Sema7A+/+ (WT) or Sema7A−/− (KO) mice was injected with MMLV CAG-GFP to label adult-born granule cells and immunostained for GFP at 14 or 56 days post-injection (dpi). DAPI is shown in red. Right panels depict representative tracings based on confocal z-stack images. (b,e) Quantification of dendritic length and number of branch points in WT (black bars) and KO (blue bars) littermates (two-way ANOVA, post-hoc t-test, 14 dpi: n=3, 56 dpi: n=4, P(56 dpi: length)=0.150 and P(56 dpi: branch points)=0.868). (c,f) Sholl analysis of the dendritic tree of GFP-labelled cells in WT (black dashed-lines) and KO mice (blue lines). Dendritic length per radius distance from soma (30 μm radius interval) at 14 dpi, but not at 56 dpi, was decreased in KO mice (14 dpi: n=117 WT cells/3 mice, n=120 KO cells/3 mice, 56 dpi: n=134 WT cells/4 mice, n=151 KO cells/4 mice. Repeated-measures ANOVA 14 dpi: F(7, 1645)=3.219, 56 dpi: F(9, 1224)=2.2560, P=0.056). (g) Schematic representation of the DG indicating the regions selected for spine density quantification. IML, inner molecular layer; OML, outer molecular layer. (h) Representative images showing spine-bearing dendritic segments in the OML and IML in WT and KO mice. (i) Quantification of spine density on adult-born granule cells (nGCs) at 56 dpi shows differences between WT (n=5) and KO (n=5) mice in the IML (post-hoc t-test: P(OML)=0.081). (j) Quantification of spine density on nGCs at 80 dpi shows differences between WT (n=3) and KO (n=3) mice in the IML and OML (Student's t-test). Data are presented as means±s.e.m. *P<0.05. Scale bars: (a,d) 25 μm; (h) 10 μm.

