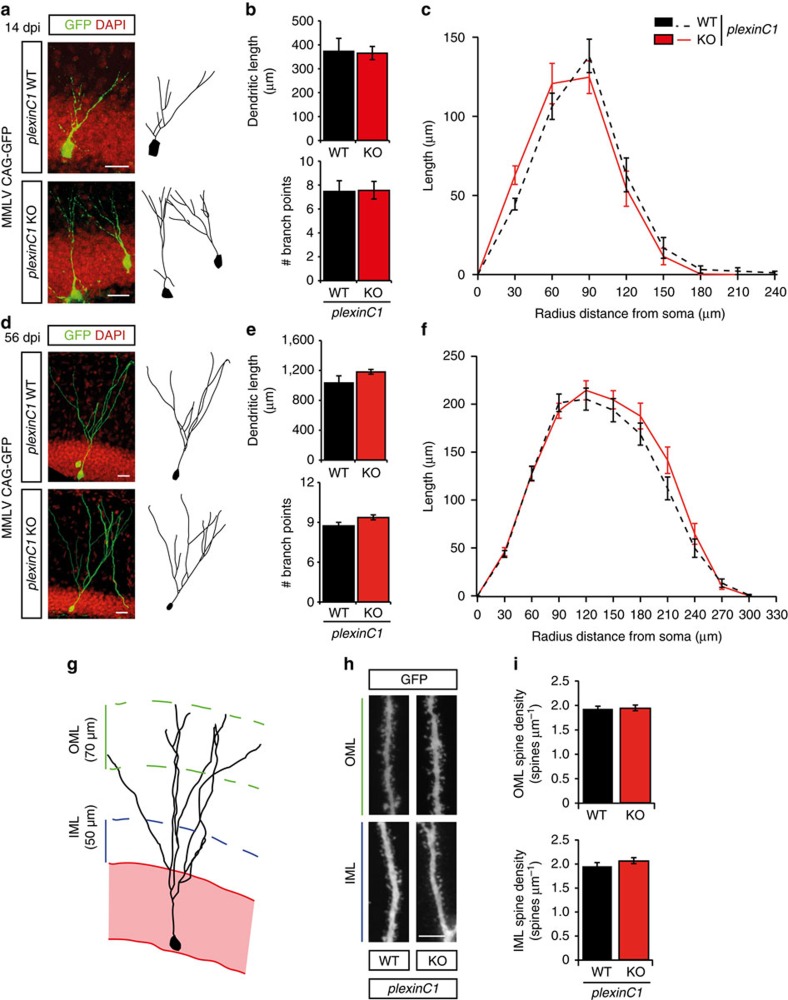
Figure 6. Dendritic growth and spine development are intact in adult-born DG granule cells in plexinC1−/− mice.
(a,d) The dentate gyrus (DG) of adult plexinC1+/+ (WT) or plexinC1−/− (KO) mice was injected with MMLV CAG-GFP to label adult-born granule cells and immunostained for GFP at 14 or 56 days post-injection (dpi). DAPI is shown in red. Right panels depict representative tracings based on confocal z-stack images. (b,e) Quantification of dendritic length and number of branch points in WT (black bars) and KO (red bars) littermates (two-way ANOVA, post-hoc t-test, 14 dpi: n=4, P(length)=0.898 and P(branch points)=0.944, 56 dpi: n=5, P(length)=0.344 and P(branch points)=0.159). (c,f) Sholl-analysis of the dendritic tree of GFP-labelled cells in WT (black dashed-lines) and KO mice (red lines). Dendritic length per radius distance from soma (30 μm radius interval) was unchanged in KO mice (14 dpi: n=45 WT cells/4 mice, n=47 KO cells/4 mice, 56 dpi: n=40 WT cells/5 mice, n=38 KO cells/5 mice. Repeated-measures ANOVA 14 dpi: F(7, 630)=1.833, P=0.139, 56 dpi: F(9, 684)=1.075, P=0.364). (g) Schematic representation of the DG indicating the regions selected for spine density quantification. IML, inner molecular layer; OML, outer molecular layer. (h) Representative images showing spine-bearing dendritic segments in the OML and the IML in WT and KO mice. (i) Quantification of spine density on adult-born granule cells at 56 dpi did not reveal differences between WT (n=5) and KO (n=5) mice (Student's t-test, P(OML)=0.8858 and P(IML)=0.2825). Whiskers represent s.e.m. Scale bars: (a,d) 25 μm; (h) 10 μm.

