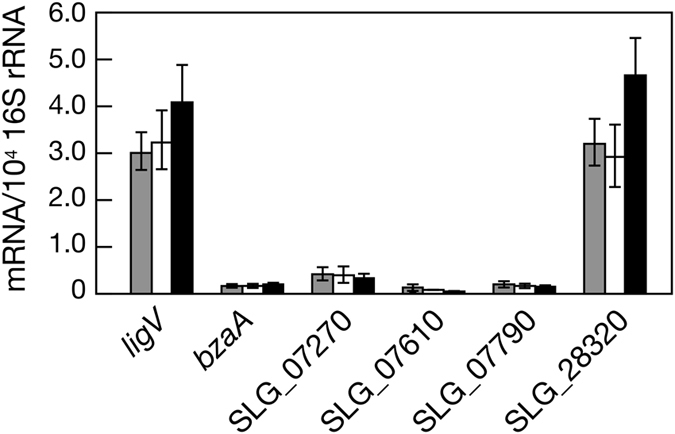
Figure 3. qRT-PCR analysis of the expression of ALDH genes in Sphingobium sp. SYK-6.

Relative mRNA abundance was determined for ligV, bzaA, SLG_07270, SLG_7610, SLG_07790, and SLG_28320. Total RNA was isolated from SYK-6 cells grown in Wx-SEMP containing 5 mM SN (gray), Wx-SEMP containing 5 mM VN (white), and Wx-SEMP (black). Values for each mRNA level were normalized to 16S rRNA. The data are mean ± standard deviation of three independent experiments.
