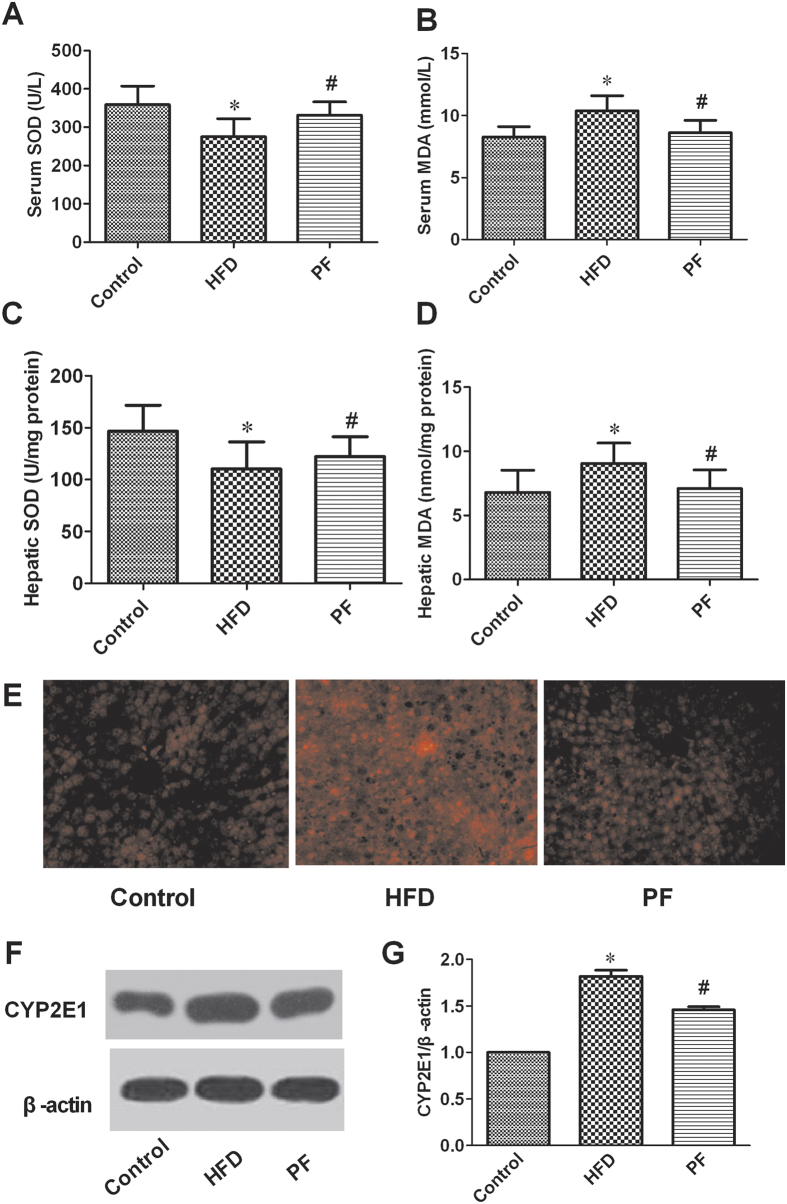
Figure 6. Effect of PF on oxidative stress.
Serum SOD (A) /MDA (B), hepatic SOD (C)/MDA (D), ROS production detected with DHE staining (Magnification, 400×) (E) and CYP2E1 protein expression (F and G) after treatment with physiological saline (HFD) or paeoniflorin. Values are means ± SD. *P < 0.05 vs. Control group; #P < 0.05 vs. HFD group. n = 8 per group.

