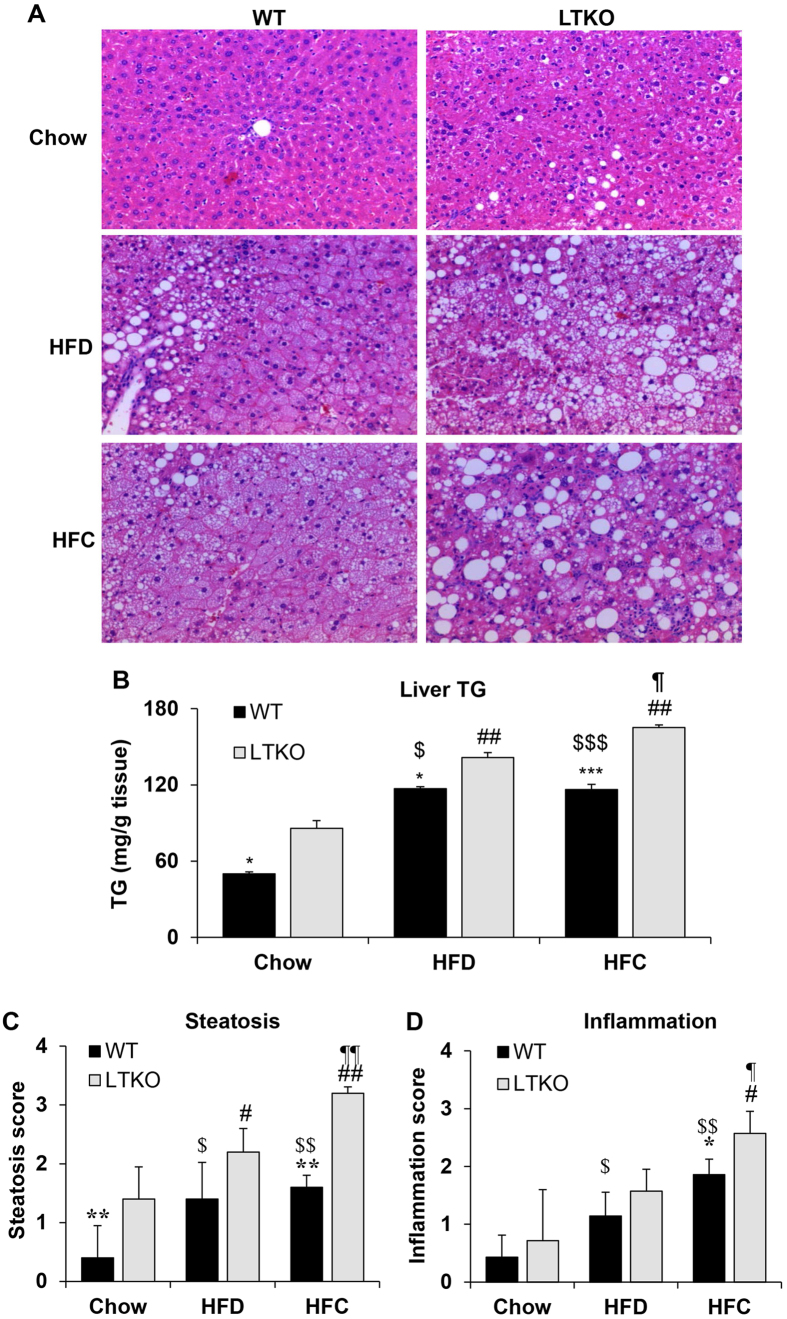
Figure 4. Hepatic steatosis and inflammation in WT and LTKO mice fed with different diets.
(A) Liver sections were stained using H&E and imaged at a magnification of 200 ×. (B) Hepatic triglycerides was analyzed in the liver of WT and LTKO mice that were fed with chow, HFD, or HFC diet. Values are expressed as mean ± SEM, n = 3–4 for each group. *p < 0.05 and ***p < 0.001 for WT vs. LTKO, ##p < 0.01 for HFC or HFD vs. Chow in LTKO mice. $p < 0.05 and $$$p < 0.001 for HFC or HFD vs. Chow in WT. ¶p < 0.05 for HFC vs. HFD in LTKO. The scores of hepatic steatosis (C) and inflammation (D) were analyzed in WT and LTKO mice fed with chow, HFD, or HFC diet. Values are expressed as mean ± SEM, n = 4 for each group. *p < 0.05 and ***p < 0.001 for WT vs. LTKO, #p < 0.05 and ##p < 0.01 for HFC or HFD vs. Chow in LTKO mice. $p < 0.05 and $$p < 0.01 for HFC or HFD vs. Chow in WT. ¶p < 0.05 and ¶¶p < 0.01 for HFC vs. HFD in LTKO.

