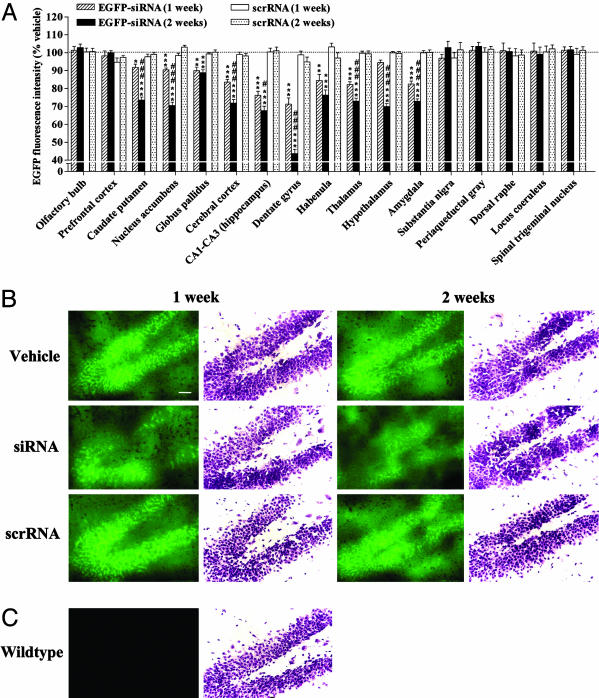
Fig. 2.
siRNA-mediated temporal and extensive down-regulation of EGFP in the mouse brain. (A) Green fluorescence images from microscopic fields of sectioned brain regions were analyzed for quantifying fluorescence intensity as an indicator of EGFP levels in each region. Bars represent mean fluorescence intensity units ± SEM of 20–40 observations (five to eight observations per animal and four to six animals per group). siRNA infusion in the mouse brain time-dependently down-regulated the EGFP levels in several brain regions tested. *, P < 0.05; **, P < 0.01; ***, P < 0.001, significantly different from vehicle- and scrRNA-treated mice in each brain region. #, P < 0.05; ###, P < 0.001, significantly different from siRNA treatment for 1 week in the same region, two-way ANOVA followed by Tukey's post hoc test. (B) Representative microscopic fluorescence images of an area of the dentate gyrus demonstrating a temporal reduction of EGFP levels in siRNA-treated mice as compared with those in vehicle- or scrRNA-treated mice. Nissl-stained adjacent brain sections also are shown for each treatment. (C) Representative microscopic fluorescence image indicating lack of any fluorescence emitted from the same area of dentate gyrus of wild-type mice that do not express EGFP. Nissl staining of adjacent section is shown. (Scale bar, 50 μm.)

