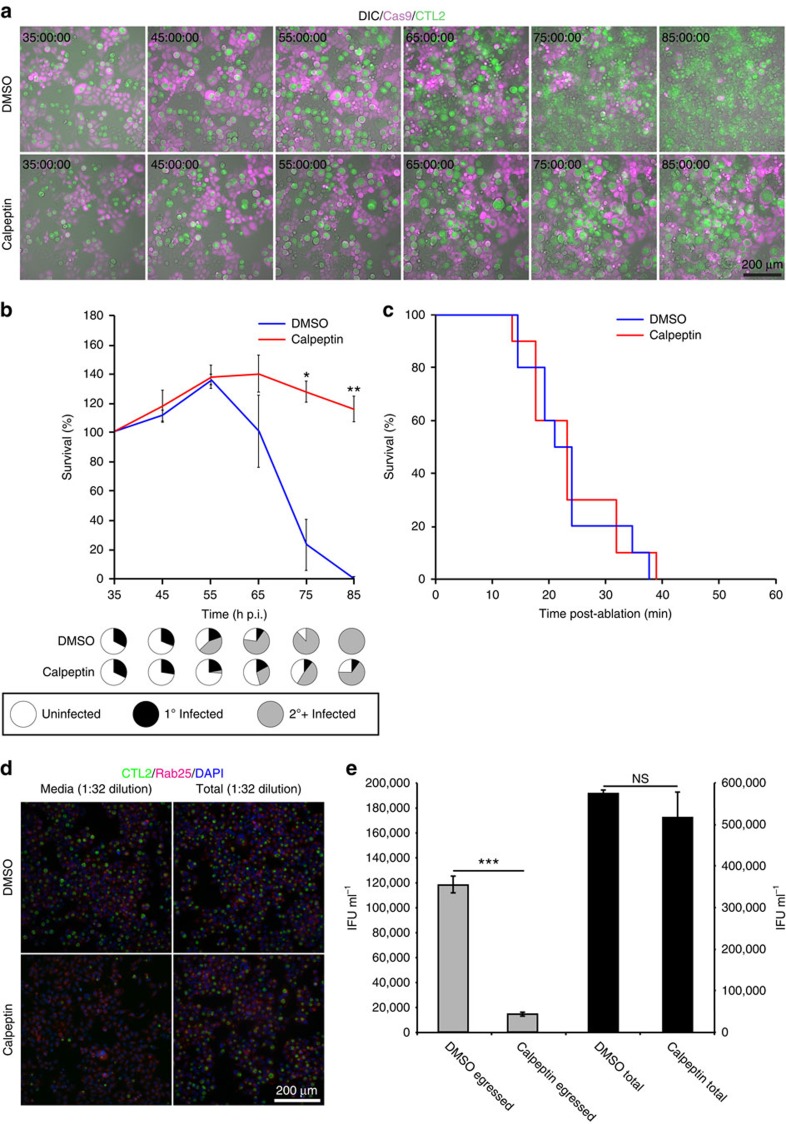
Figure 4. Calpain inhibitors inhibit inclusion rupture.
(a) Time-lapse videomicroscopy of mCherry-Cas9 stable HeLa cells infected from 8–72 h p.i. with GFP-CTL2 (MOI∼0.5) in the presence or absence of 100 μM calpeptin. (b) Quantification of native egress-induced cell death under the indicated conditions. Presented in pie-charts are the proportions of primary infected, secondary infected and uninfected cells surviving cells at the indicated time point as monitored by GFP-CTL2 fluorescence. N=3 biological replicates with >200 cells counted per replicate. Error bars represent the s.d. the mean. *P≤0.05; **P≤0.01; ***P≤0.001; NS, Not Significant (Unpaired Student's t-test). (c) Quantification of inclusion rupture induced cell death under the indicated conditions. N=10 biological replicates for each condition. (d) mCherry-Rab25 and CFP-H2B stable HeLa cells infected under the conditions as indicated from HeLa cells infected for 72 h p.i. with GFP-CTL2 (MOI∼0.5). Presented images were captured 24 h p.i. (e) Infectious progeny-forming units in media and whole cell lysates from infected cells cultured in the presence or absence of calpeptin were quantified. N=3, Error bars represent the s.d. from the mean. *P≤0.05; **P≤0.01; ***P≤0.001 (unpaired Student's t-test).

