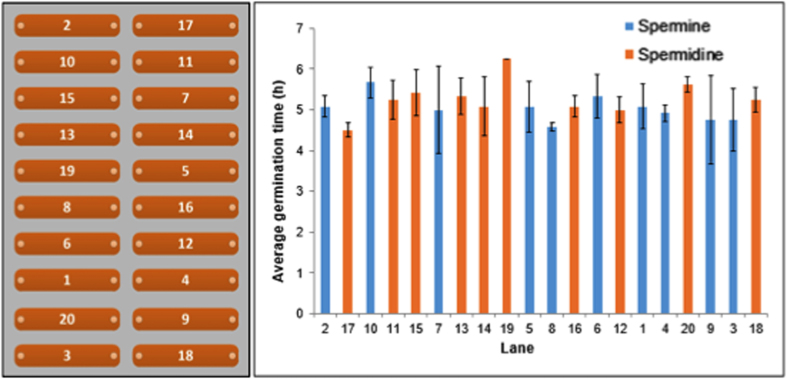
Figure 3. Variation in time taken to show first sign of germination among and within channels.
Channel numbers are shown in the left panel. Data are mean and standard errors of three observations in each channel of a typical experiment. Details of the data are presented in Supplementary Table 1. Data are not significantly different (p = 0.83 for observations within channel and p = 0.37 for observations among 20 channels).

